UK Seafood
in Numbers 2022
Welcome to UK Seafood in Numbers 2022. With over 7,000 miles of coastline around the UK, the seafood industry is an important part of our heritage. A thriving seafood industry is an important part of our future too.
Learn where our seafood comes from, how our UK seafood industry is performing and how much seafood we are eating.
Scroll or tab through each section to see the data or select an icon to go straight to the sector of your choice.

Where our seafood comes from
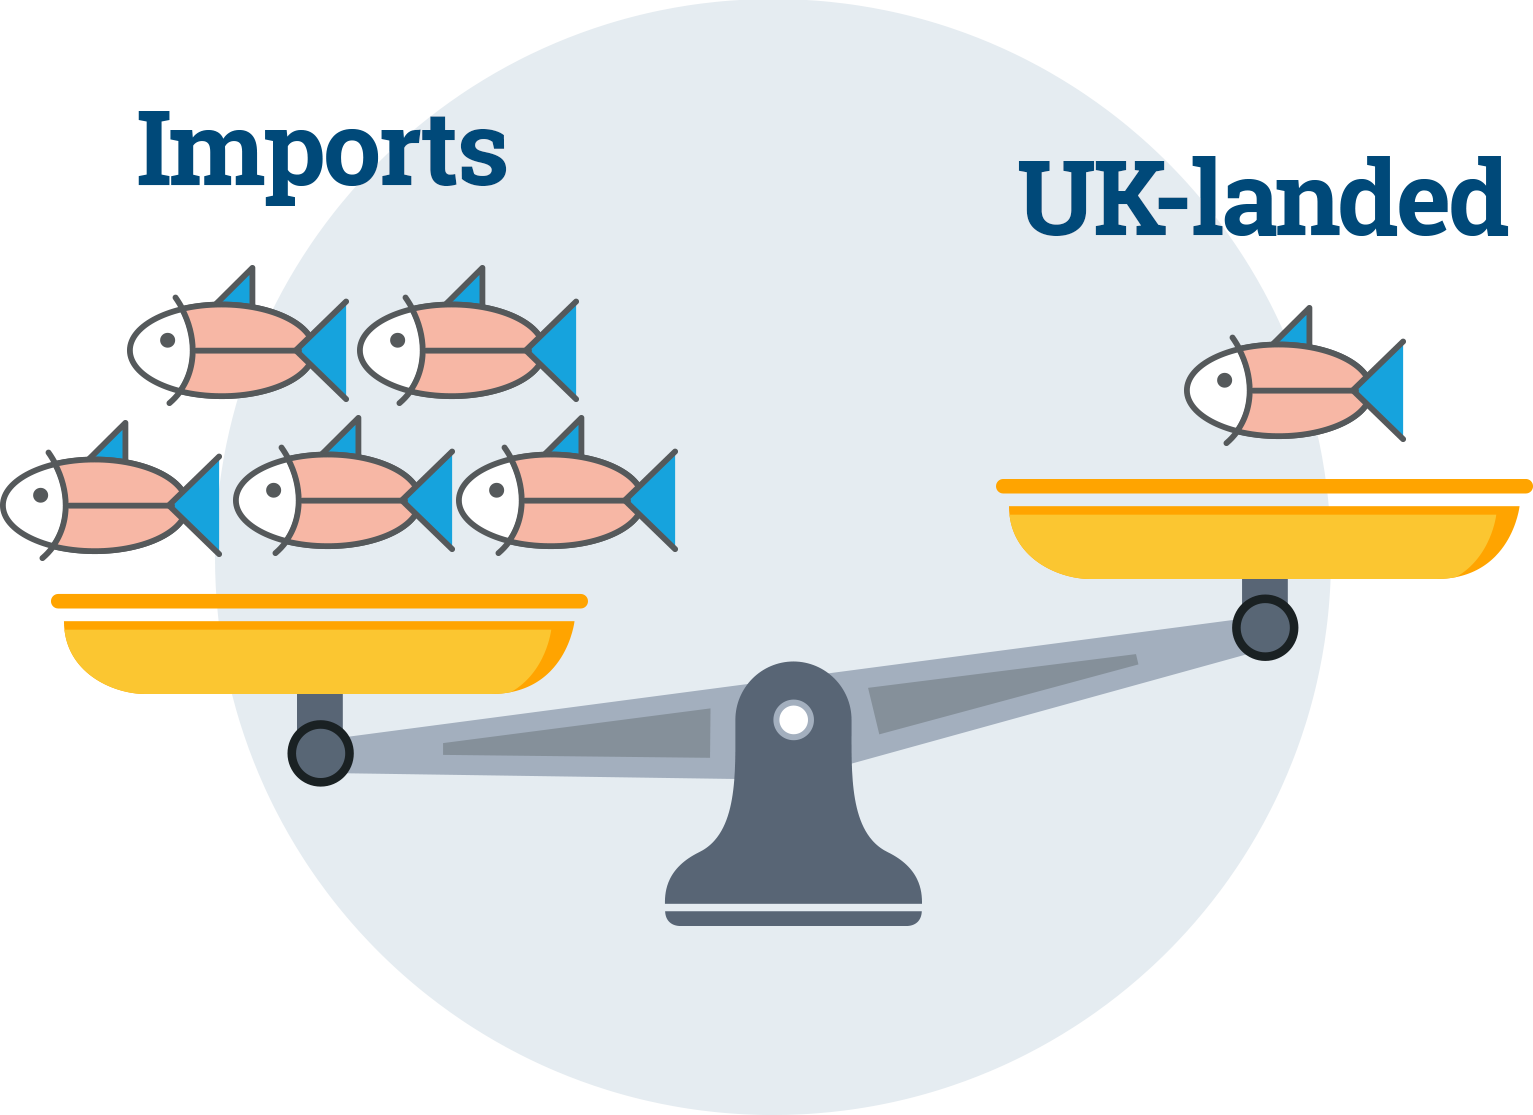
Most of our seafood supply is imported.
The value of seafood imports was nearly five times higher than the
value
of fish landed
into the UK.
The volume of fish
imported in 2022 is more than 11 times the
weight
of Buckingham Palace

Where our seafood comes from (volume and value)
Imports to the UK
£3,640m (+16%*)
1,194,317 tonnes live weight (+0.3%*)
Fish farmed in UK 2021
£1,167m (+15%*)
239,300 tonnes
(+9%*)
Fish landed in UK
£757m (+7%*)
410,563 tonnes (-1%*)
*Data in brackets show changes from previous 12 months
Where our seafood goes
We export most of the seafood landed or farmed in the UK and 23% of the fish caught by the UK fleet is landed directly abroad.
Our seafood is internationally renowned for its quality and
provenance. Although demand
has become stagnant.
Exports
from the UK
Value
£1,722m (+7%)
Volume
454,144 tonnes (-2%)

UK vessel
landings abroad
Value
£233m (+7%)
Volume
222,708 tonnes (-9%)
