Imports into the UK
China and Norway are the main suppliers of imported seafood to the UK.
In
2022, the average price for imported seafood experienced its highest annual
inflation rate of the
past decade.
This price inflation drove
UK seafood import value to increase 16%,
the highest year on year growth of the past 10 years.

Did you know? We import most of the seafood we eat in the UK. The top five species imported are the most popular seafood for UK consumers.

Top 5 countries (value):
- Norway – £649m (+30%)
- Iceland – £286m (+3%)
- China – £278m (+44%)
- Vietnam – £255m (+26%)
- Faroe Islands – £231m (+31%)
Total imports: £3,637m (+16%)

Top 5 countries (volume-tonnes)
- China – 153,266 (+8%)
- Norway – 151,191 (+4%)
- Iceland – 90,945 (-17%)
- Netherlands – 70,298 (+97%)
- Vietnam – 67,657 (+5%)
Total imports: 1,194,317 tonnes (+0.3%)

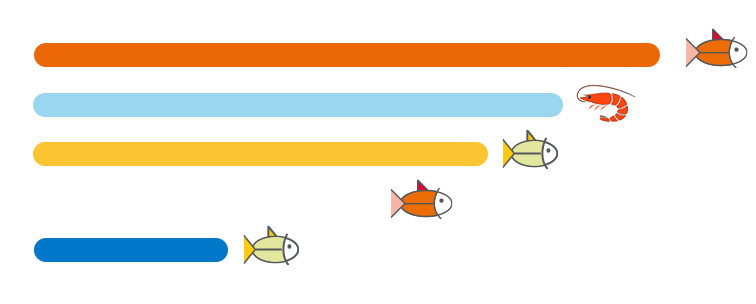
Top 5 species (value)
- 1. Salmon – £783m (+13%)
- 2. Shrimps and Prawns – £665m (+9%)
- 3. Cod – £564m (+15%)
- 4. Tuna – £403m (+8%)
- 5. Haddock – £234m (+18%)

Top 5 species (volume-tonnes)
- 1. Tuna – 221,269 (+4%)
- 2. Cod – 212,613 (-11%)
- 3. Salmon – 130,042 (-9%)
- 4. Shrimp and Prawns – 111,258 (-5%)
- 5. Haddock – 100,708 (-9%)


Data notes and sources
Landings
Data Source: Marine Management Organisation.
Reference: MMO monthly landings statistics
https://www.gov.uk/government/
collections/monthly-uk-seafisheries-statistics
Fleet economic performance
Data source: Seafish
Reference: Seafish Fleet Enquiry Tool
https://public.tableau.com/app/profile/
seafish/viz/FleetEnquiryTool/1Overview
Note that 2022 performance and landings data is provisional
Aquaculture production
Data Source: Centre for Environment Fisheries and Aquaculture (CEFAS)
Reference: Data supplied directly to Seafish
Trade (Imports and Exports)
Data Source: HMRC monthly data via Business Trade Statistics (BTS), processed by Seafish.
Reference: Seafish Trade and Tariff Tool
https://public.tableau.com/profile/seafish#!/
vizhome/SeafishTradeandTariffTool/
Overview
Note that 2022 trade data is provisional
Processing
Data source: Seafish
Reference: Seafish Processing Enquiry Tool
https://public.tableau.com/app/profile/
seafish/viz/ProcessingEnquiryTool/
2021Overview
Retail data
NielsenIQ ScanTrack data to 52 week ending 31/12/2022; Reference - Monthly Retail Report 52
week ending (w/e) data to 31.12.22; Link to report on MI Portal; Seafish.Org link to retail page and factsheets.
Foodservice data
Circana data to year end December 2022; Reference - 2022 Q4 NPD Data Sheet; Link to report on
MI Portal; Seafish.Org link to foodservice page and factsheets.