Exports
The UK exported seafood to 117 countries although
74% of
value went to the top five countries.
The average price for exported seafood in 2022 reached its highest in
a decade while the volume exported was the lowest it has been over the same time.
Adjusted for inflation the value of exported seafood in 2022 was 3% higher than it was 10 years ago.

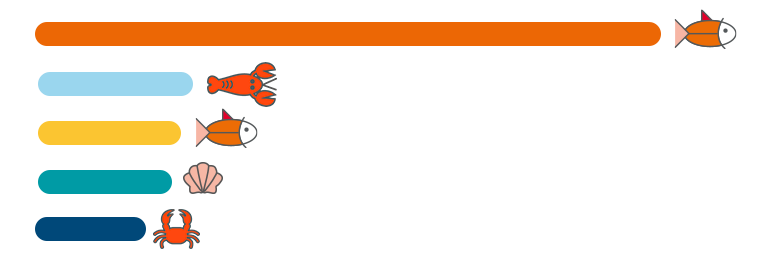
Top 5 countries (value):
- France – £783m (+4%)
- United States – £242m (+18%)
- Spain – £100m (+26%)
- Netherlands – £73m (+17%)
- China – £69m (-6%)
Total exports: £1,722m (+7%)

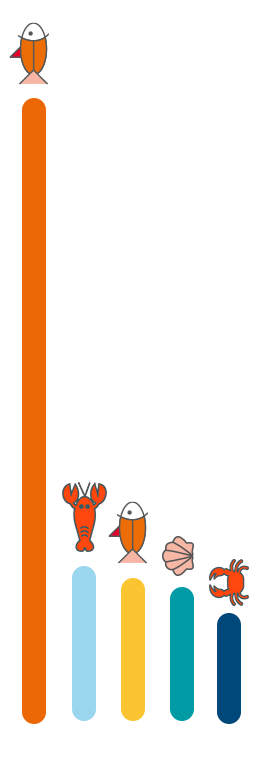
Top 5 countries (volume-tonnes):
- France – 170,430 (-11%)
- Netherlands – 34,586 (+17%)
- United States – 31,876 (-5%)
- Spain – 30,252 (+19%)
- Italy – 20,287 (+45%)
Total exports: £454,144 tonnes (-2%)

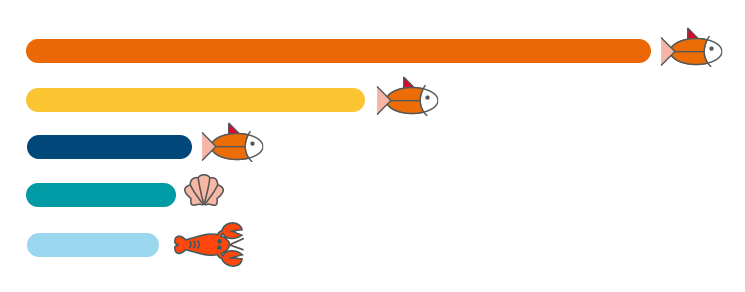
Top 5 species (value)
- 1. Salmon – £704m (-4%)
- 2. Nephrops – £125m (+13%)
- 3. Mackerel – £107m (+12%)
- 4. Scallops – £90m (+19%)
- 5. Crabs – £77m (+15%)
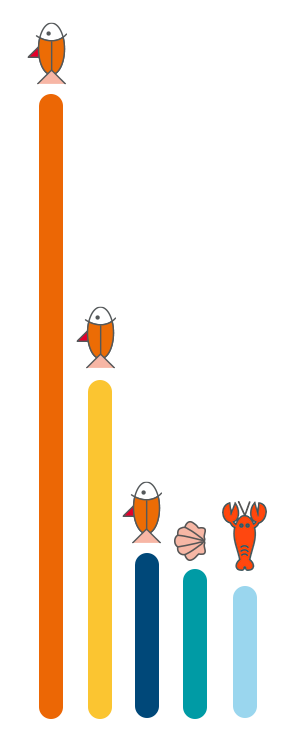
Top 5 species (volume-tonnes)
- 1. Salmon – 111,034 (-21%)
- 2. Mackerel – 59,329 (+6%)
- 3. Herring – 31,580 (+50%)
- 4. Scallops – 26,398 (-10%)
- 5. Nephrops – 22,643 (-6%)
Data notes and sources
Landings
Data Source: Marine Management Organisation.
Reference: MMO monthly landings statistics
https://www.gov.uk/government/
collections/monthly-uk-seafisheries-statistics
Fleet economic performance
Data source: Seafish
Reference: Seafish Fleet Enquiry Tool
https://public.tableau.com/app/profile/
seafish/viz/FleetEnquiryTool/1Overview
Note that 2022 performance and landings data is provisional
Aquaculture production
Data Source: Centre for Environment Fisheries and Aquaculture (CEFAS)
Reference: Data supplied directly to Seafish
Trade (Imports and Exports)
Data Source: HMRC monthly data via Business Trade Statistics (BTS), processed by Seafish.
Reference: Seafish Trade and Tariff Tool
https://public.tableau.com/profile/seafish#!/
vizhome/SeafishTradeandTariffTool/
Overview
Note that 2022 trade data is provisional
Processing
Data source: Seafish
Reference: Seafish Processing Enquiry Tool
https://public.tableau.com/app/profile/
seafish/viz/ProcessingEnquiryTool/
2021Overview
Retail data
NielsenIQ ScanTrack data to 52 week ending 31/12/2022; Reference - Monthly Retail Report 52
week ending (w/e) data to 31.12.22; Link to report on MI Portal; Seafish.Org link to retail page and factsheets.
Foodservice data
Circana data to year end December 2022; Reference - 2022 Q4 NPD Data Sheet; Link to report on
MI Portal; Seafish.Org link to foodservice page and factsheets.