Helping our seafood sector to thrive.
We know seafood is the way forward. When the seafood sector thrives, the whole nation thrives. And that's why we're doing everything we can to support it.
Who we are and what we do
Contact us
Subscribe to news from Seafish
News & blogs
Seafish board reappointments confirmed
News article
10 April 2024

The UK’s free trade agreements – January to March 2024
News article
09 April 2024
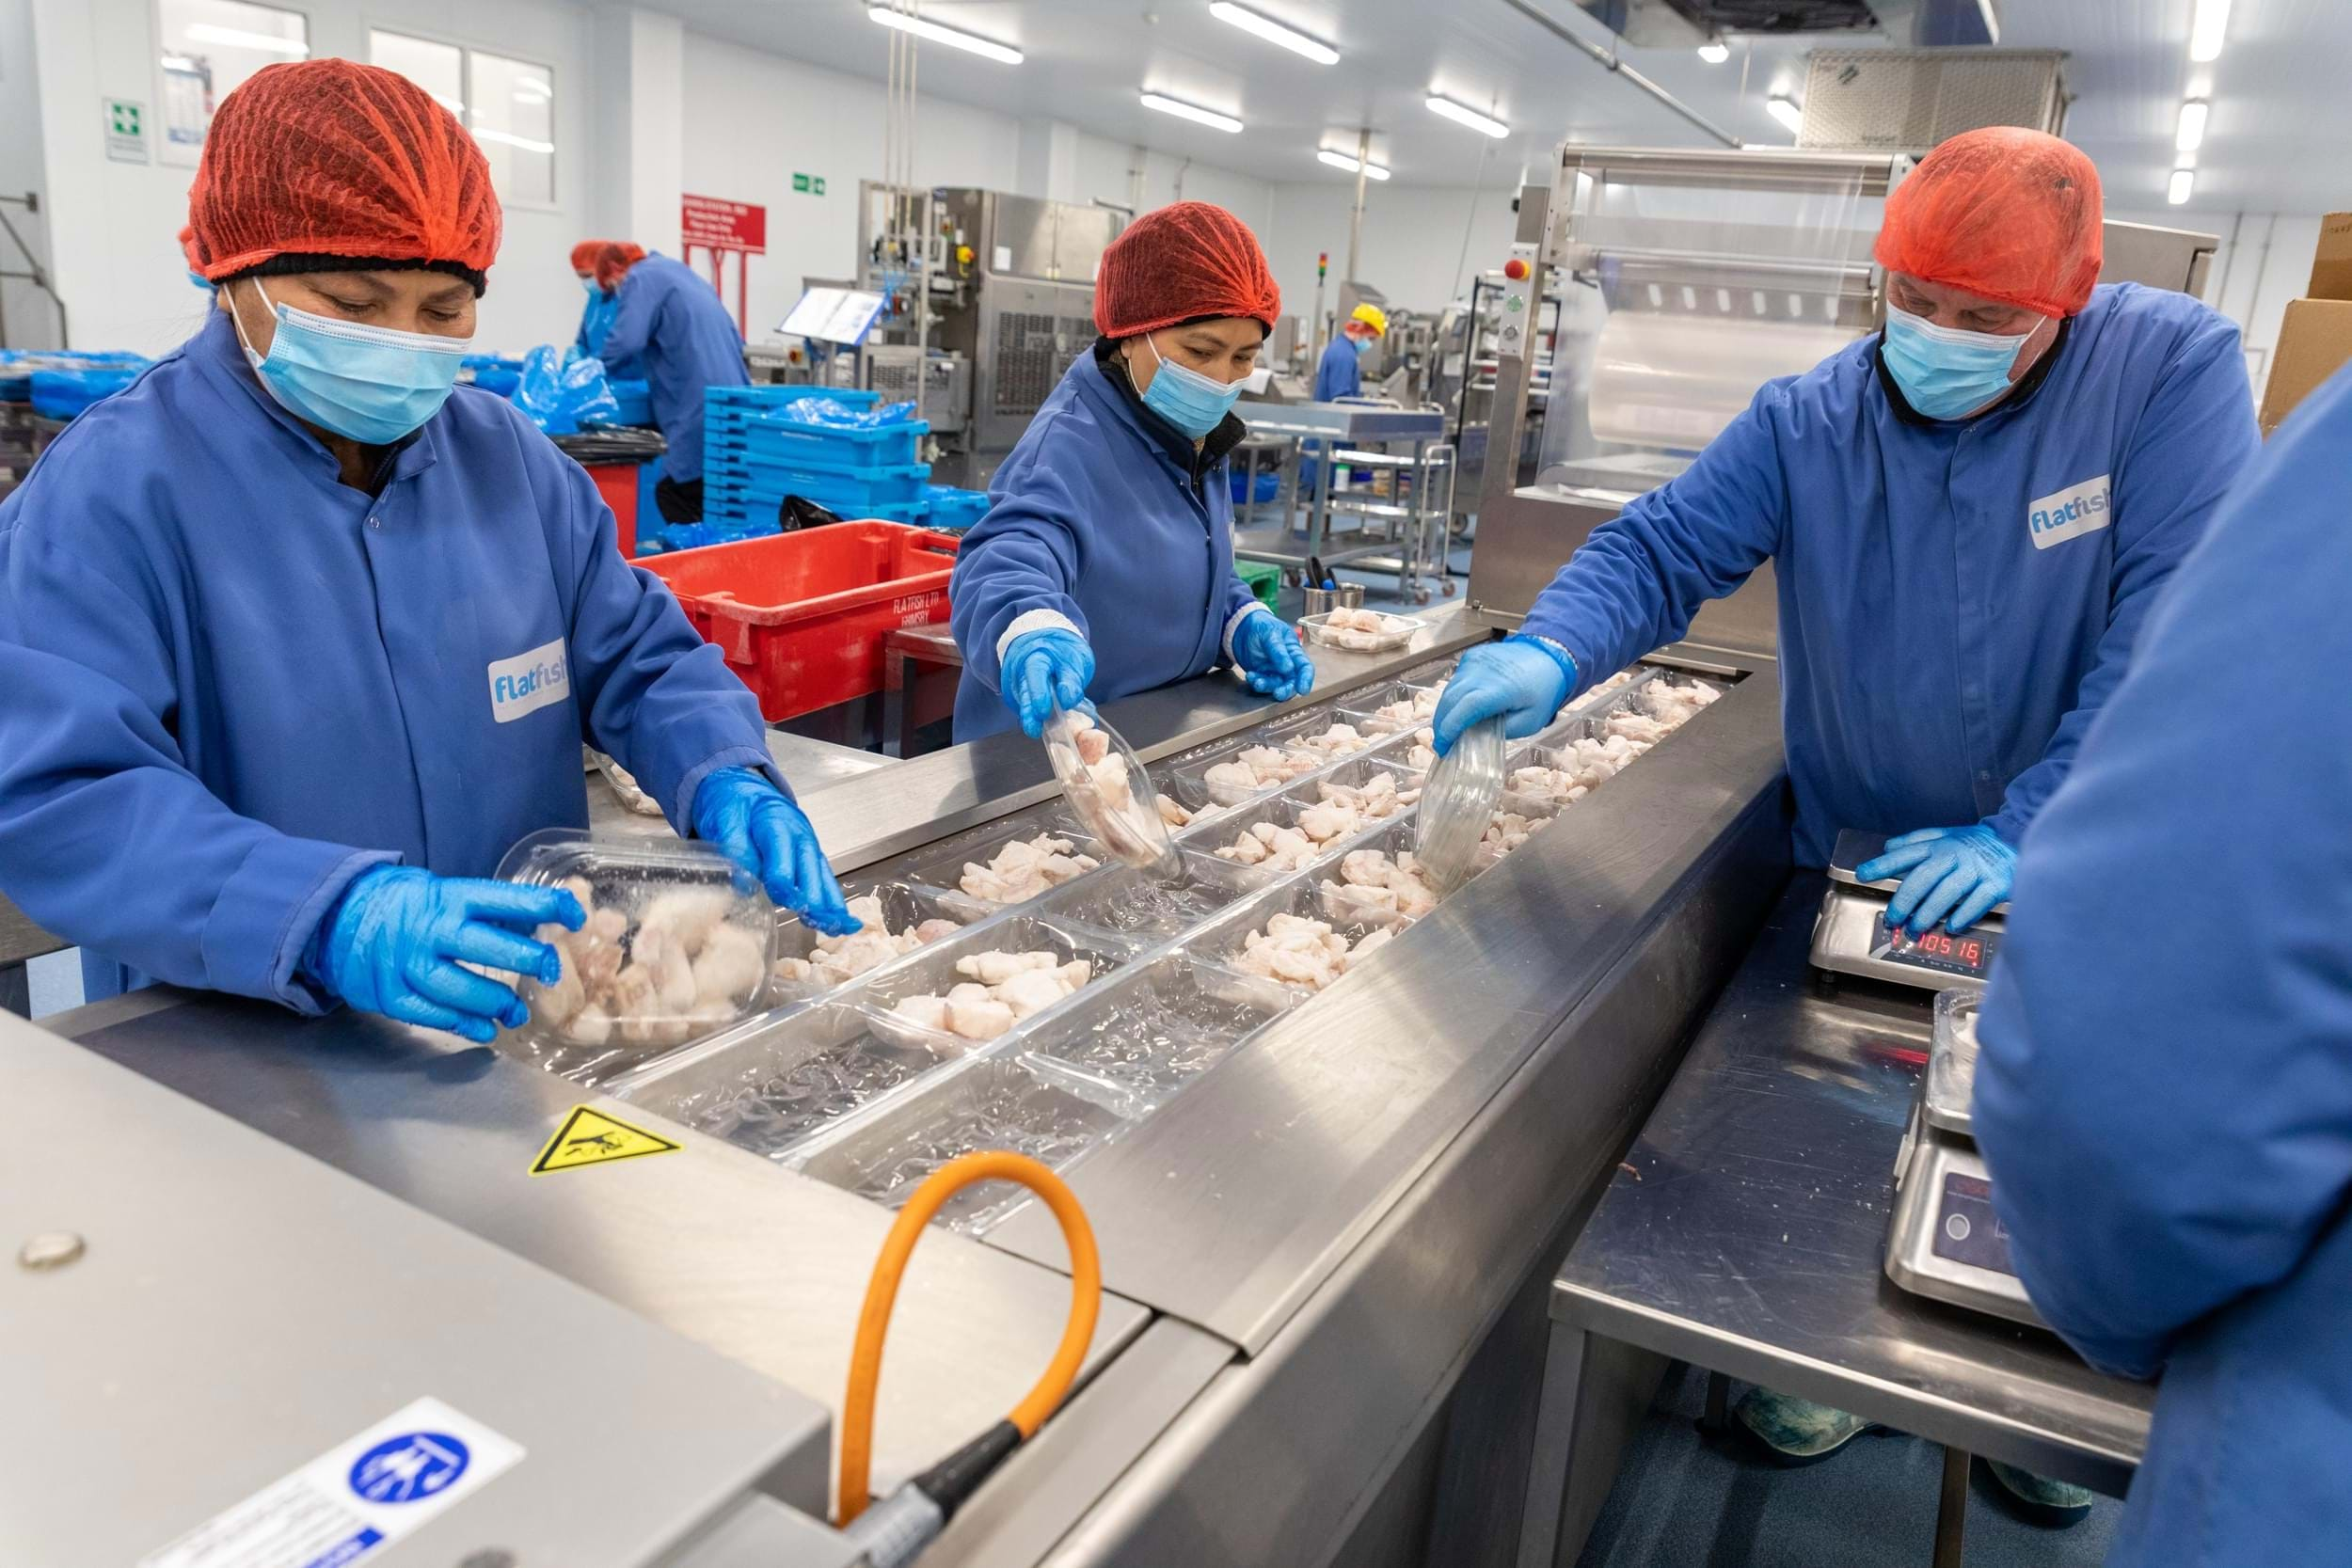
2023 July to September supply chain analysis: Grants awarded and businesses prepare for regulatory changes
Blog article
09 April 2024
2024 seafood processing survey now live
News article
21 March 2024
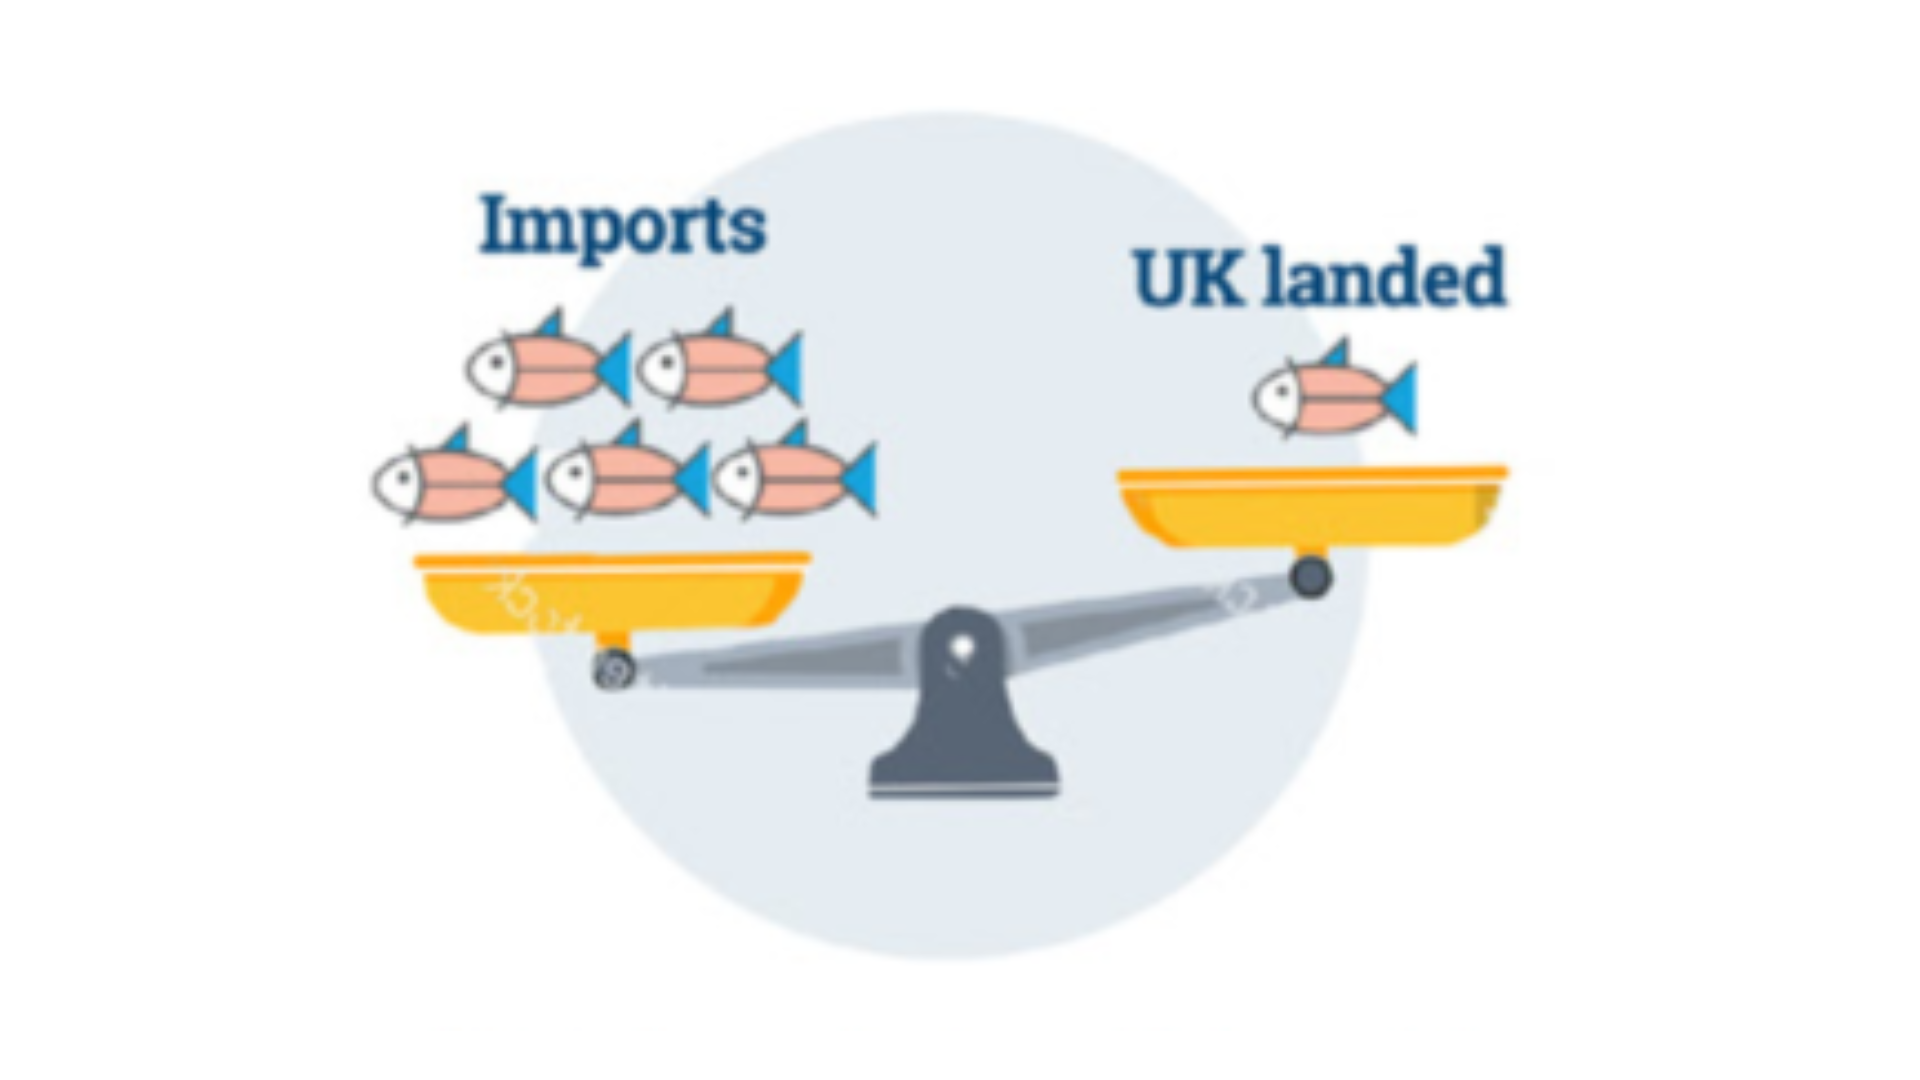
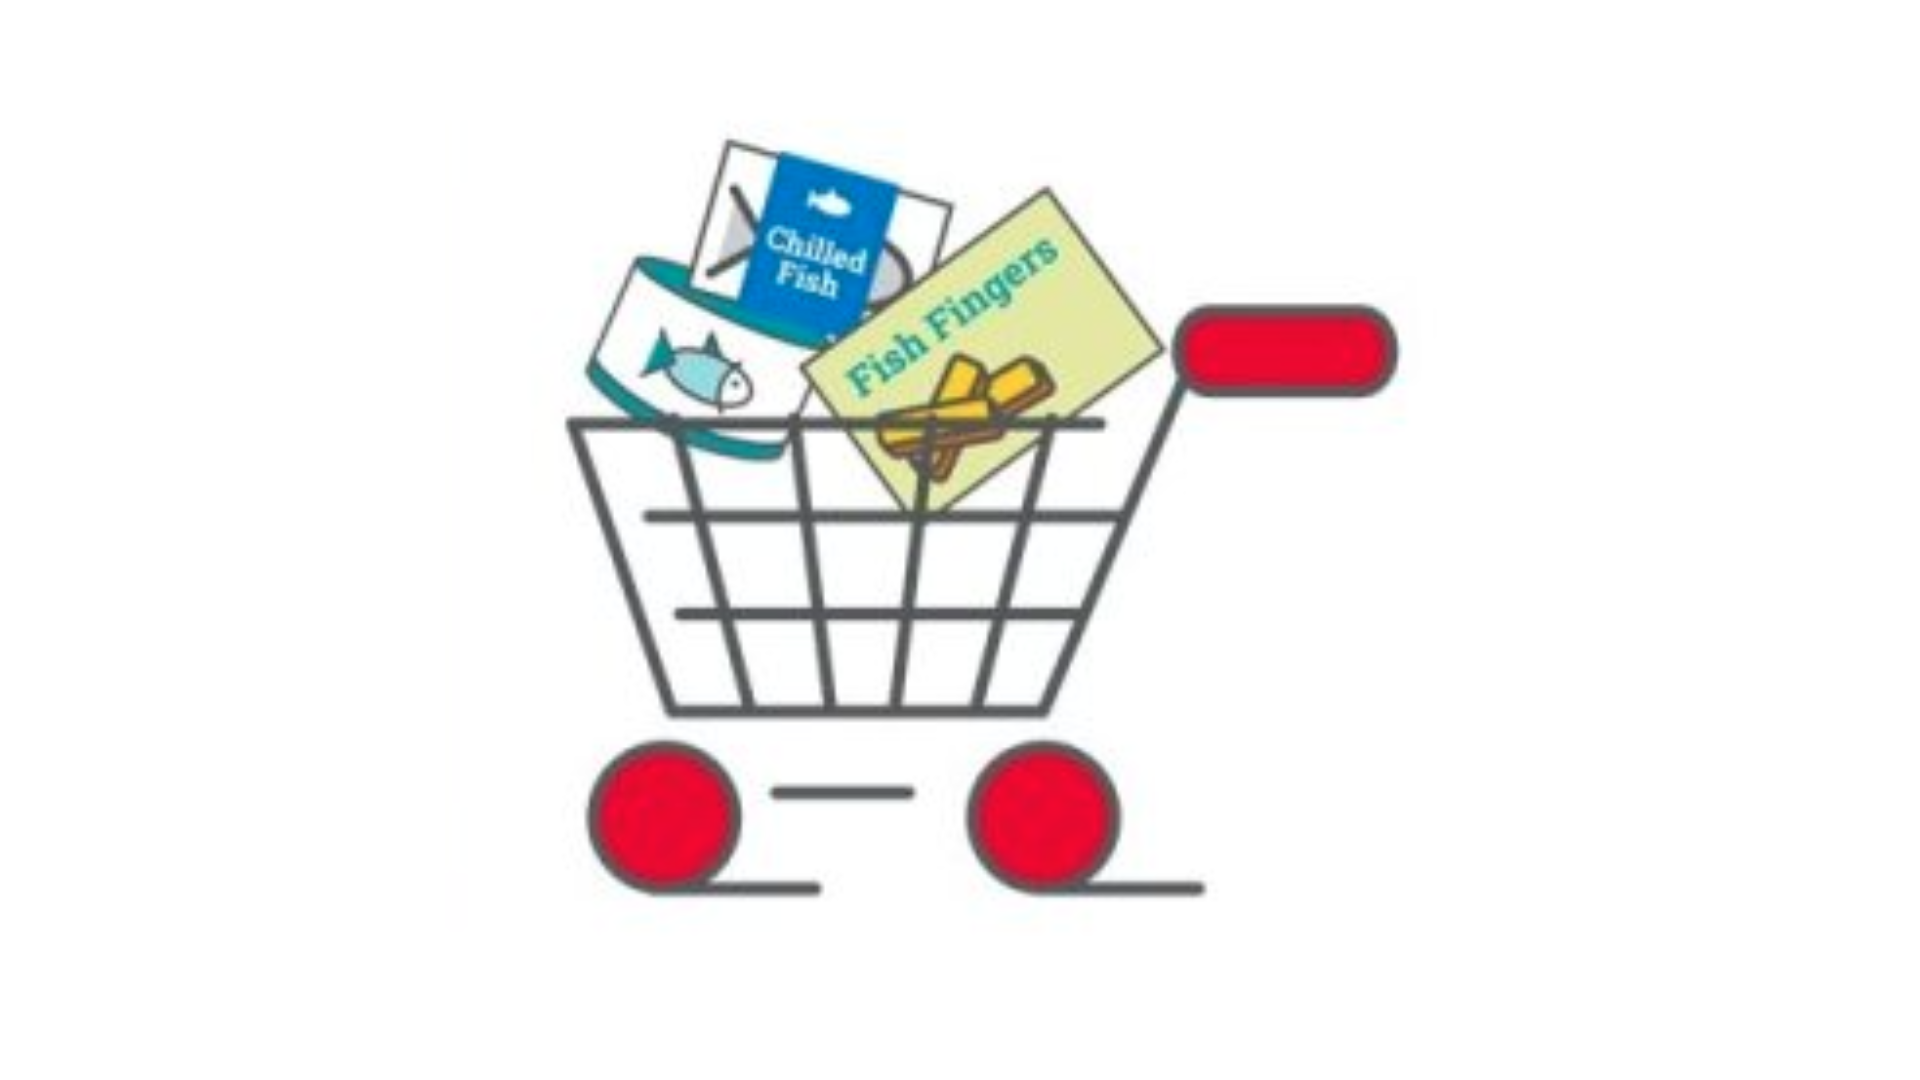
Seafood in Numbers
Data on performance of the UK seafood industry, which covers landings, aquaculture, processing, imports, exports and seafood consumption in the UK.

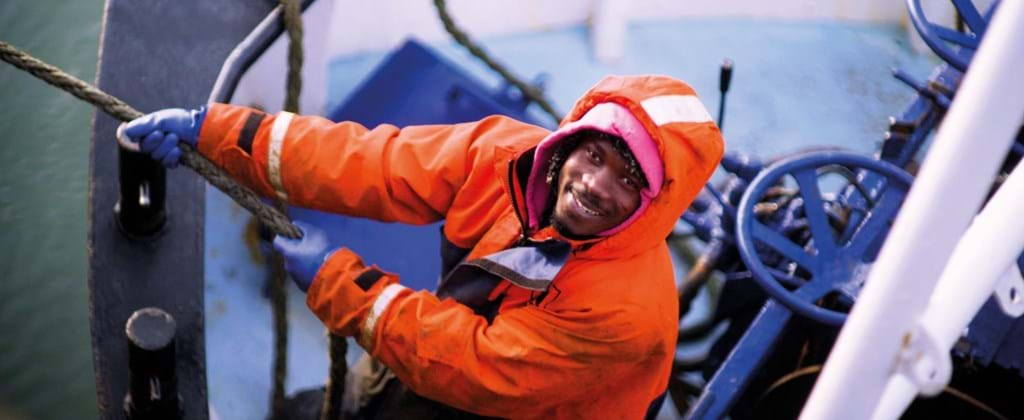
Safety, training and employment resources

Upcoming events
23 to 25 April 2024
UK Pavilion at Seafood Expo Global 2024
Hall 2, Stand 2I601, Fira Gran Via, Barcelona
08 May 2024
ACIG: Aquaculture innovation and supply chain resilience
Friends House, 173-177 Euston Road, London, NW1 2BJ
09 to 10 May 2024
Seafish stand at the Scottish Skipper Expo 2024
P&J Live Exhibition Arena, Aberdeen