UK seafood supply chain overview
Find out how the seafood supply chain in the UK is performing. Our data includes landings, aquaculture, processing, imports, exports and consumption.
Seafood is a globally traded commodity, with complex and integrated supply chains. In the UK, we import most of the seafood we eat and export most of the seafood we catch or farm.
Overall, our UK seafood industry is worth £9.5bn per annum. This is 5% down on pre-covid levels as the sector tries to recover from challenges brought on by Brexit, Covid and the current economic situation.
Annual seafood supply chain data
Each year, we pull together all the data we have on seafood supply, processing and markets to tell the story of how the seafood industry is performing. UK Seafood in Numbers 2022 is our latest product. It is a great resource for anyone who wants to know more about the seafood industry.
Visit our Seafood In Numbers interactive webpage to explore the story and the 2022 data in full.
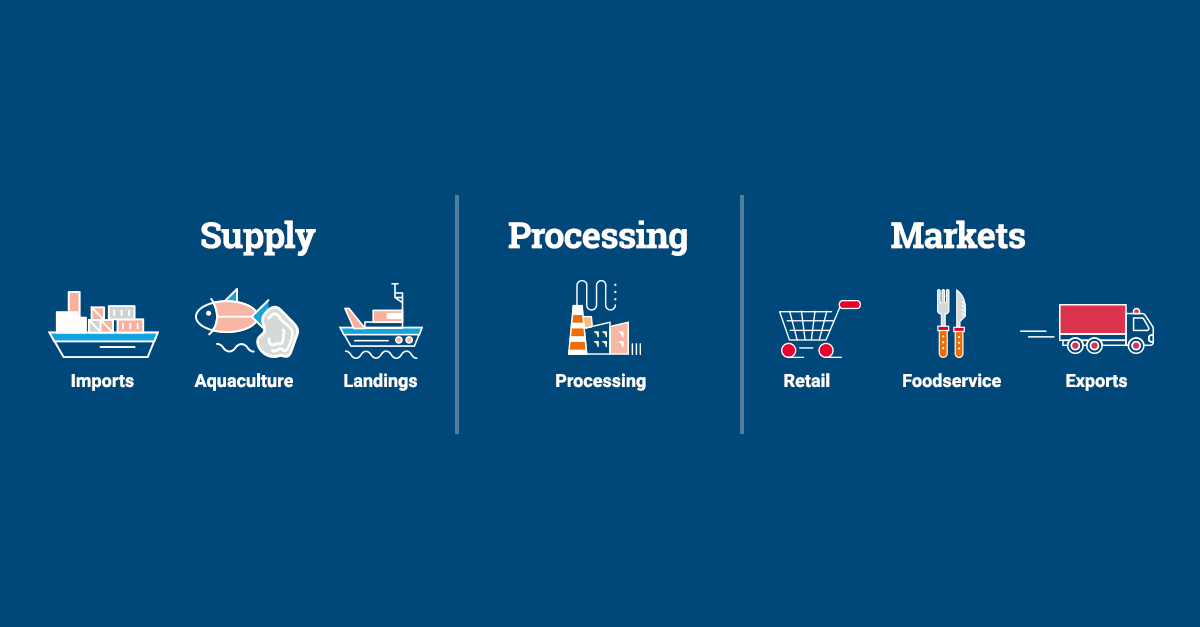
UK seafood supply and markets
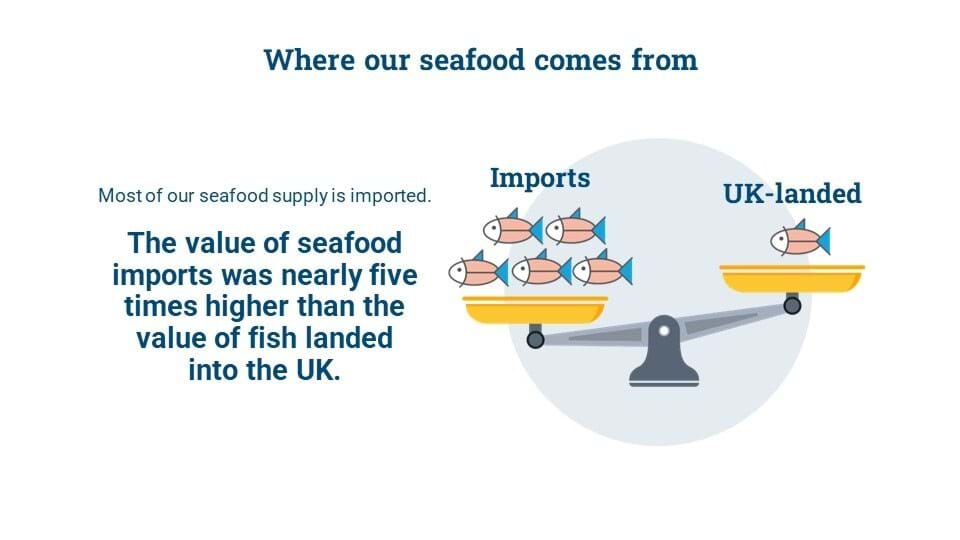
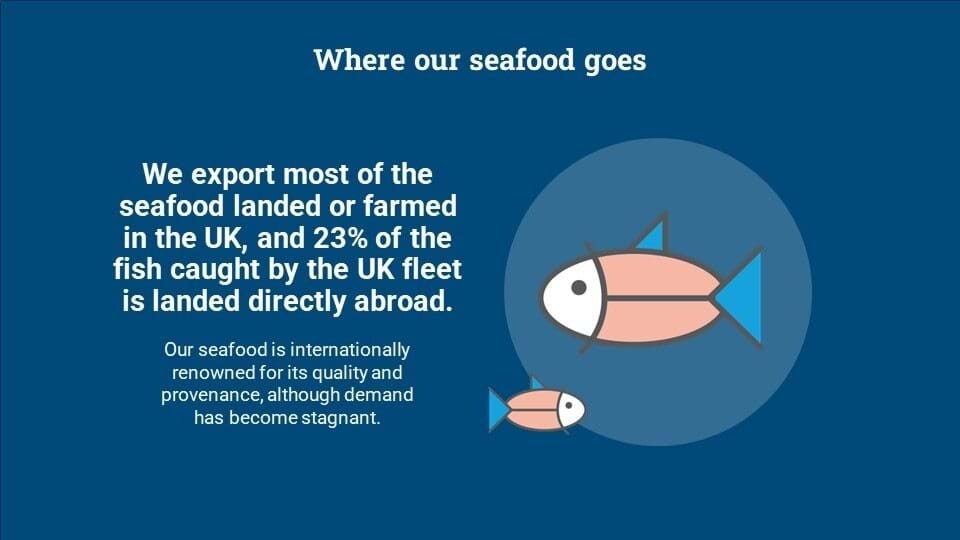
Most of the seafood we eat in the UK is imported and we export most of what we catch and farm.
In 2022, the supply of our seafood in the UK came from:
- Imports worth 3.6billion equal to 1,193,768 tonnes. By value, 47% of imports were wild caught and 34% were farmed.
- Fish farmed in the UK worth £1 billion equal to 216,790 tonnes.
- Fish landed in the UK worth £757million equal to 410,563 tonnes.
In 2022, seafood we produced or sold went to:
- Retailers in the UK worth £4.1 billion equal to 391,5762 tonnes
- Foodservices outlets in Great Britain worth £4.3 billion equal to 130,085 tonnes
- Exported around the world worth £1.7 billion equal to 454,210 tonnes
- UK fishing vessels also landed £233 million of catch overseas equal to 222,708 tonnes
The information in UK Seafood in Numbers 2021 is also available on our dedicated sector pages:
-
Fishing data and insight
-
Aquaculture research and insight
-
Seafood processing data and insight
-
Market supply data and insight
-
Retail data and insight
-
Foodservice data and insight
UK Seafood in Numbers is published annually in the Autumn. If you are looking for more recent data, email Seafish@seafish.co.uk or get in touch with our Press Office for media enquiries.
Quarterly seafood supply chain analysis
The seafood industry is diverse and there are many factors that influence its performance. We look at what is affecting the seafood supply chain each quarter and publish data and analysis. The reports are released around 4 months after the end of each quarter.
Our most recent report covered January to March 2023. You can access the analysis on our Tableau dashboard using the link below (this will take you to the Tableau website). You can also download PDFs from our website. The most recent reports are listed below.
-
UK Seafood Supply Chain Overview: April-June 2023
-
UK Seafood Supply Chain Overview: January-March 2023
-
UK Seafood Supply Chain Overview: October-December 2022
-
UK Seafood Supply Chain Overview: July-September 2022
-
UK Seafood Supply Chain Overview: April-June 2022
-
UK Seafood Supply Chain Overview: January-March 2022
To access reports prior to 2022, which date back to January 2020, please search for 'UK Seafood Supply Chain Overview' by using the search tool at the top of this webpage.