What we learned from the first six months of Love Seafood
We’ve been monitoring the performance of our consumer marketing activity since we launched Love Seafood in October last year. We track this through quarterly reports compiled internally by our Marketing team and externally by the agencies we work with. We’ve now pulled the data and insight together to assess how Love Seafood activity performed in its first six months.

What’s covered in the review?
We measure against a financial year running April to March, so the first period of Love Seafood reporting includes live activity from October 2020 to March 2021. During this timeframe we delivered:
- The Love Seafood brand launch and ‘Love Seafood Social’ online festival in October 2020
- A variety of Love Seafood Christmas consumer recipe content and advertising in December
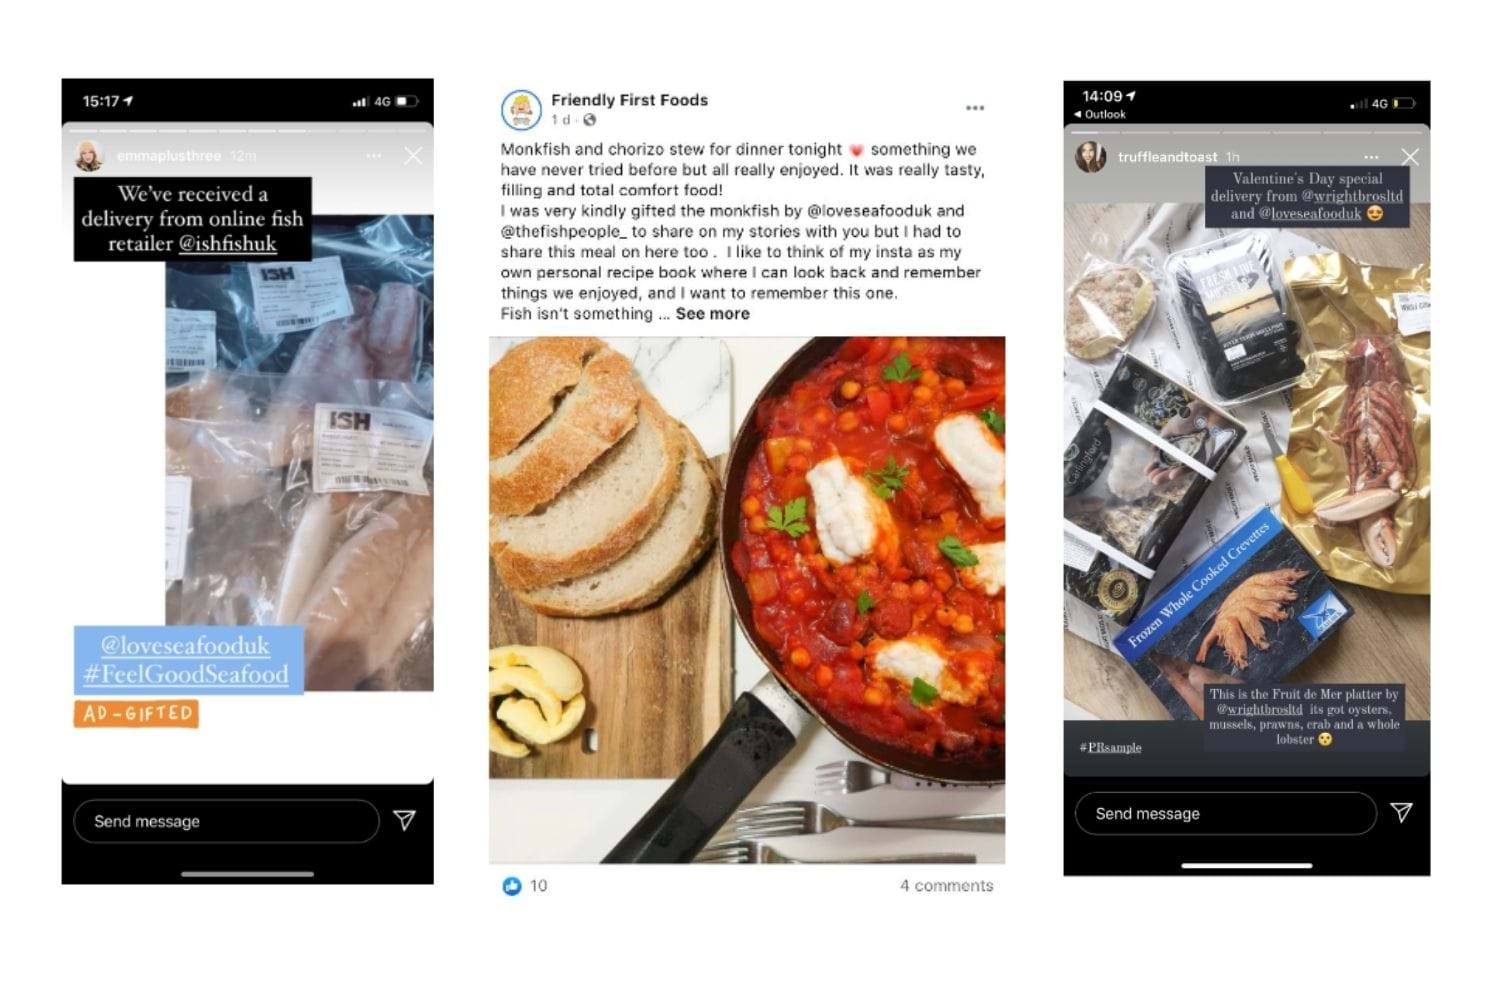
- Shellfish campaign activity for Valentine’s Day in early 2021, which was PR-led
- Recipe booklets, fish & chips posters and business masterclasses – all delivered to support trade in 2021 and beyond
- A national media-focused spring campaign featuring UK species of fish and shellfish
- And a constant drum beat of ‘always-on’ generic Love Seafood brand activity, across multiple channels
Our reporting looks at both short-term tactical indicators and longer-term objectives. We measure overall success against our Love Seafood strategic vision by looking at our three core objectives:
- Drive awareness of Love Seafood brand and activity
- Drive consumer understanding of ‘reasons to buy’ (balanced living, choice and convenience)
- Drive consumer consideration and desire to eat more seafood, more often
Each objective is supported by ‘Hero Metrics' and individual key performance indicators (KPIs). We monitor these via a Love Seafood data dashboard. We also check against standard channel measures, including media reach and content engagement. Our KPIs are benchmarked against previous Seafish marketing activities and food & drink brand averages.
In addition, we use YouGov surveys to measure brand tracking. This provides further insight on longer-term attitudinal shifts. We carried out an initial benchmark survey in late September 2020 and a follow-up in May 2021. We’ll continue to carry out brand tracking, every six months during Love Seafood’s lifespan. For each survey, we ask questions on four key areas:
- Food consumption in general – looking at consumption of certain food types over the past six months, and whether it has increased, decreased or stayed the same.
- Awareness of seafood brands in general – monitoring if consumers have heard of certain seafood brands.
- Frequency of seafood consumption – studying how often consumers eat seafood as a main meal, lunch or snack.
- General perception of seafood as a source of food – looking at whether consumers agree or disagree with perception-based statements about the value of seafood.
So, how did we do?
Here’s an overview of what the first six months of Love Seafood activity has achieved:
Reach and engagement performance
- An earned (organic) media reach of approximately 117 million.
- More than 120,000 targeted consumers visited the Love Seafood website.
- Our campaign activity featured over 220 times in national and regional press publications.
- Over five million people engaged with our content via social media.
Performance indicators for objectives
Analysis for Objective 1 - ‘awareness’:
- In general activity has performed solidly against our awareness driving objective. We achieved both Hero Metrics and exceeded 4 out of 6 KPIs.
- Our strongest area of performance was achieving organic social reach. This performed above and beyond expectations in the latter three months, thanks to additional activity as part of the spring campaign.
- Our poorest area of performance was monthly website traffic. Overall, this fell short of benchmark, although it did creep up in the final months. Our ‘share of search’ also struggled, falling short of competitor brands. Two areas we’re already revitalising and putting focus on into the next 12 months of activity.
Analysis for Objective 2 - ‘understanding’:
- Love Seafood activity performed effectively against our consumer understanding objective. We achieved both Hero Metrics and exceeded 4 out of 5 KPIs.
- Our strongest area of performance was driving repeat user visits to the Love Seafood website. We’ve significantly improved on previous benchmarks in this area. This shows we’re already re-engaging positively with our new audience groups.
- Our poorest area of performance was across our key messaging pull-through. This will be a key area for focus moving forward, as we need to ensure we seed our brand pillars throughout our work.
Analysis for Objective 3 - ‘consideration’:
- The first six months of activity performed very effectively against our consumer consideration objective. We achieved both Hero Metrics and exceeded 6.5 out of our 7 KPIs.
- Our strongest area of performance was increasing our website referral rate from social media activity. This was consistently higher than expected, and the biggest driver of web traffic.
- Our poorest area of performance was consumer engagement with a third-party retailer tool on the website. This underperformed for the first three months and only scraped benchmark in the second three months. We’ve since retired this tool and have developed our own custom model - which is already outperforming the third party offering.
Performance against brand tracking
We’re not seeing much of a change between our benchmarking survey and our six-month follow-up. This is aligned with our expectations, as we believe it’ll take a generational shift in attitudes to positively change perceptions of seafood. It’s important to remind ourselves that our strategic mandate is built on a 20-year plan to achieve this.
Of the four main areas for focus, there’s only one where we’re seeing some small, but perhaps indicative, shifts in attitude. This is linked to Area Four, which looks at the perceptions of ‘seafood as a general source of food’. These positive and negative shifts were as follows:
- Negative: Slightly fewer people agree that seafood is good value for money, vs. 2020.
- Positive: Slightly more people claim to be buying sustainable seafood, vs 2020.
- Negative: Slightly fewer people agree there are lots of types of seafood available, vs. 2020.
- Negative: Slightly fewer people agree that fish and chips is a takeaway treat, vs. 2020.
What will we take away from this?
Given we’re only in our second six months of activity, across a 20-year plan, we’re confident it’s still early days. We don’t think it would be sensible to assign any changes in tactics based on our brand tracking results.
Instead, we’ll look to our shorter-term channel outcomes, to produce marginal gains in areas we can have impact. This should help bolster these attitudinal measures for the future.
As part of this, we’ll look at making adjustments to, and investment in, areas including:
- Looking at how we drive search traffic to the website.
- Looking at where we can focus messaging efforts most effectively.
- Continuing to increase subscribers and keep their engagement consistent and regular.
- Building on positives around content engagement and enhancing certain strands of the user journey.
- Maintaining our focus on social media to drive traffic to the website but also leveraging other channels to produce similar referral results.
- Adjusting benchmarks where we’ve clearly exceeded, to provide more challenge and drive stronger results into the future.
We’ll keep monitoring performance through our regular evaluation and we’ll carry out our next brand tracking survey in November 2021.
Further information
Please note, as from 11 April 2022, the Love Seafood initiative and all associated activity has come to an end. Thank you for your support and for being a part of the journey to ‘bring on better living’.