Latest UK Seafood Trade Data
The latest Bi-annual UK Seafood Trade Report offers an overview of the current state of the UK seafood trade, highlighting key trends and examining the influence of national, international, and global events on market dynamics.
This page offers a summary of the report’s main findings. Download the full report at the bottom of this page for valuable insights into the challenges and opportunities for both UK and international businesses engaged with the seafood supply chain.
Analysed HMRC trade data is provisional and subject to change.
This page has information on:
UK seafood sector outpaces broader UK trade despite a challenging global trade landscape and continued Brexit barriers in 2024.
- The global trading environment remained challenging in 2024, shaped by rising geopolitical tensions following the wars in Gaza and Ukraine. An escalating trade war between the US and China poses significant risks for 2025 for global trade stability and growth.
- In 2024, the UK seafood sector outperformed the general UK goods trade. However, it faced challenges due to non-tariff barriers with the EU. Trade negotiations with the EU and trade agreements beyond the EU offer a promising outlook but progress will also depend on geopolitical stability, and consumer demand.
UK’s imported seafood supply returns to growth following rising consumption
- UK seafood imports grew in 2024, driven by rising domestic demand and shifts in global supply. Pelagic species, particularly tuna, showed the strongest growth, while whitefish saw little growth but remained the largest category.
- Import trends varied by species and trading partner, with notable growth from countries like Ecuador, Canada, and Vietnam, while imports from traditional suppliers like Norway and the EU declined. Overall, falling prices across key species and products hindered import value growth.
Salmon and mackerel drive continued UK seafood export growth
- UK seafood exports continued in growth in 2024, driven largely by strong performance in salmon and mackerel exports to key markets like the EU, US, and China.
- In contrast, shellfish and demersal species exports declined overall, particularly to the EU, though some gains were seen in Asian markets and select species like Nephrops and cod.
In 2024, the UK seafood trade was shaped by global and domestic pressures. Ongoing political tensions, the lasting impact of Brexit and shifting trade policies posed challenges to businesses beginning to recover from the impacts of Covid-19 and the 2020-2023 energy crisis. Together, these factors influenced the UK's trade balance and seafood market trends.
UK seafood trade shows resilience during global trade uncertainty
Geopolitical tensions impacted global trade in 2024, with the US and China increasing tariffs on goods like electric vehicles. The Middle East conflict disrupted trade flows due to Houthi rebel attacks on maritime traffic in the Red Sea, leading to lower global growth forecasts and increased uncertainty. Although a ceasefire in early 2025 has reduced attacks, concerns about Red Sea shipping lane security remains.
The UK is a net importer of internationally traded goods with a trade deficit of £201 billion in 2024. Both goods exports and imports declined compared to 2023, with exports down 4.9% to £359bn, and imports down 3.5% to £561bn. (ONS: UK Trade December 2024)
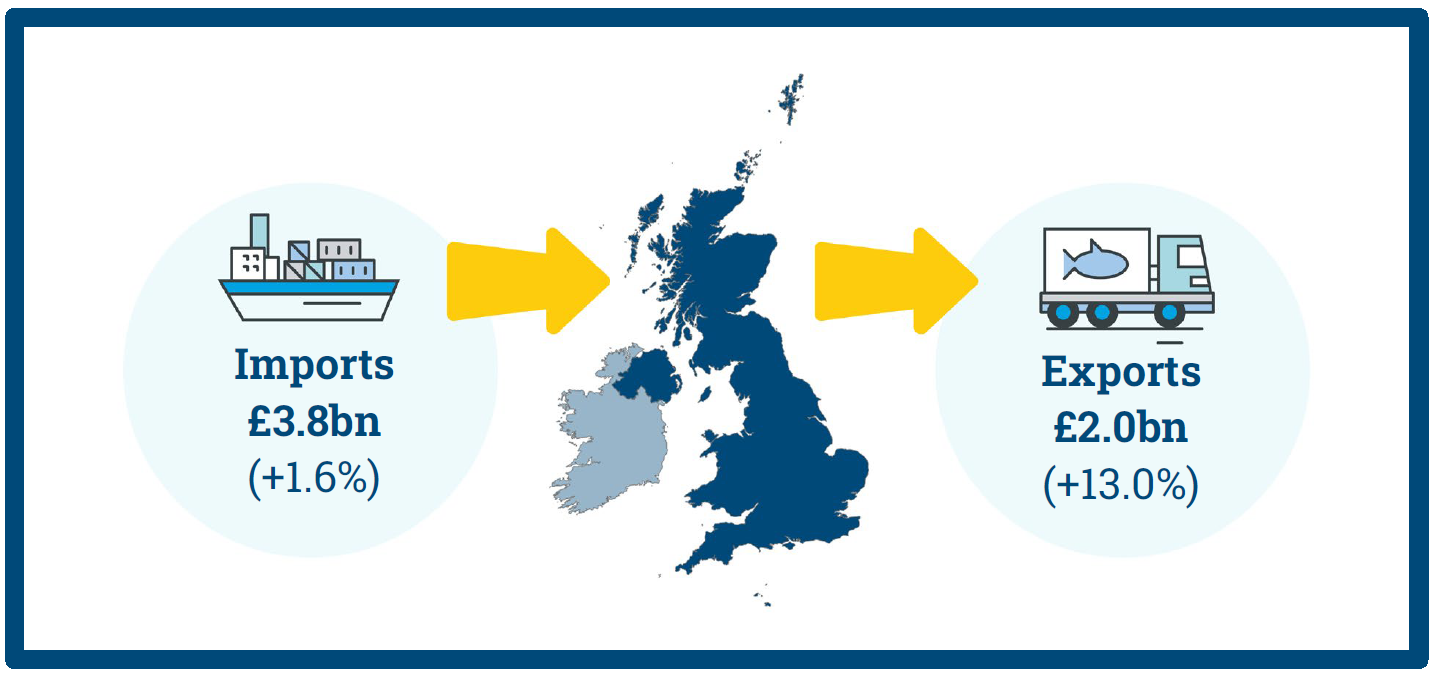
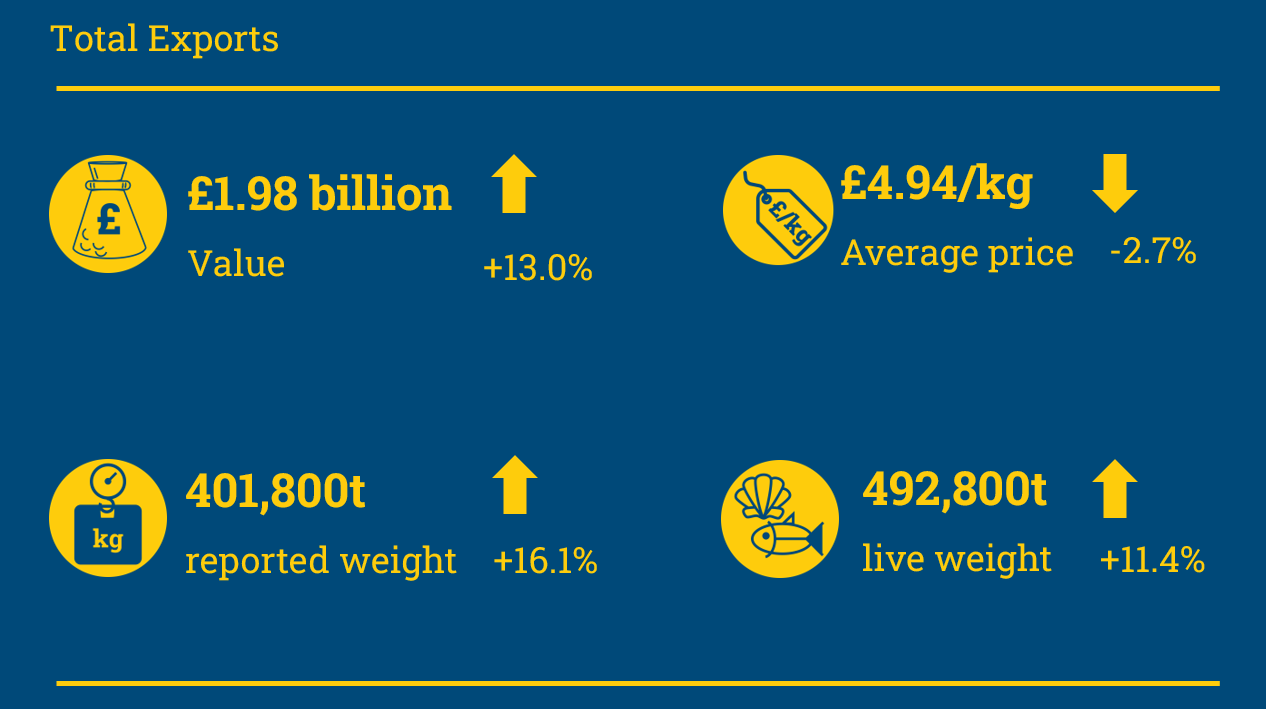
Seafood performed better than total UK goods trade, showing growth in 2024. Export value increased 13.0% to £2.0bn, and Import value increased 1.6% to £3.8bn. Seafood consumption in the UK also returned to full growth in 2024 as sales increased in retail and foodservice. See more on UK seafood consumption.
The 2025 outlook remains uncertain, as new US tariffs and retaliatory measures from trading partners threaten major disruption. In early 2025, the US introduced tariffs of 10%-48% on imports from nearly 60 countries including the UK, with China facing additional tariffs of over 100%. The tariffs were subject to a 90-day pause at the time of this report’s publication.
There were significant additional tariffs expected for major warm water prawn-producing and exporting nations, such as India, Indonesia, and Vietnam, expecting to be hit with 27%, 32%, and 46% tariffs, respectively. If these tariffs are imposed, they will likely reduce U.S. seafood imports from heavily targeted countries and raise domestic prices. Trade flows may shift toward less affected suppliers, such as Ecuador, in the case of warm water shrimp, which faces only a 10 percent tariff.
Overall, the sector faces supply chain disruptions and increased volatility as countries adjust to the new tariff landscape.
Non-tariff barriers continued to weigh on UK-EU seafood trade
Closer to home, the UK continued to face high costs and increased risks of trading with the EU due to non-tariff barriers in 2024. These included health certificates, increased border checks, and destructive testing of products, impacting exports of agrifood products and seafood from Great Britain to the EU and Northern Ireland. This has particularly affected the export market for the UK’s shellfish and whitefish industry.
The 2024 rollout of the Border Target Operating Model (BTOM) posed similar risks for EU seafood importers to Great Britain, but disruption was minimal.
Exporters have faced increased risk of shipments being rejected or partially destroyed through testing, as well as inconsistent interpretations of import requirements at border inspection posts. The cost associated with needing to identify and manage divergence in two regulatory regimes has also been a barrier to trade.
The Food and Drink Federation (FDF) reports that UK food and drink exports to the EU fell by 19.8% on average from 2020-2024 compared to 2015-2019. While some of this decline is due to the long-term impacts of COVID-19 and the war in Ukraine, Germany, the Netherlands, and Italy saw export growth during the same period despite facing similar issues.
Opportunities in new trade deals
To ease these barriers, the government has pursued and agreed a new sanitary and phytosanitary (SPS) agreement (or veterinary agreement) with the EU (Gov.uk news release: May 2025). An SPS agreement provides an opportunity to harmonise or mutually recognise food safety standards, cutting the costs of compliance for exporters and importers. Under the Ireland/Northern Ireland Protocol, Northern Ireland's SPS rules remained aligned with those of the EU.
The EU remains the UK’s top seafood trading partner with a 67% market share of UK seafood exports. The most recent data available indicates that Seafood consumption in the EU declined in 2023, as did the volume of seafood imported into the EU. The decline is linked to higher prices per kilo and reduced consumer purchasing power.
The UK joined the Comprehensive and Progressive Agreement for Trans-Pacific Partnership (CPTPP) in 2024, diversifying trade beyond the EU. UK businesses can benefit from tariff reductions and better market access to 10 other nations. See more on CPTPP guidance for seafood traders from Seafish. Amid rising geopolitical uncertainty in 2025, the UK has negotiated a free trade agreement with India and a trade deal with the US.
These challenges affecting UK seafood businesses’ ability to trade internationally have existed alongside pressures relating to domestic regulation, such as the Packaging Extended Producer Responsibility (pEPR). More information on how Seafish is supporting is available here.
Overall, the UK seafood sector shows signs of recovery, with a UK-EU trade agreement offering a promising sign for further progress. Future opportunities for a recovering UK seafood trade environment will depend on how recent and future trade agreements play out at home and abroad. Growth also hinges on the ability of business to adapt to increased geopolitical uncertainty.
Explore the full Seafood Trade Report
Dive deeper into the latest trends, data, and insights shaping UK seafood trade. The full trade report is is available to download at the bottom of this page.
The UK’s Imported Seafood supply returns to growth in 2024.
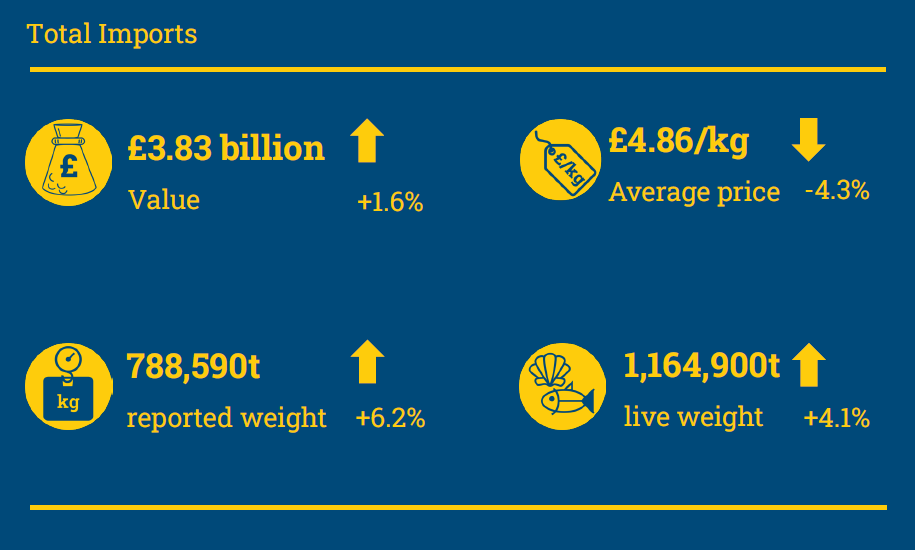
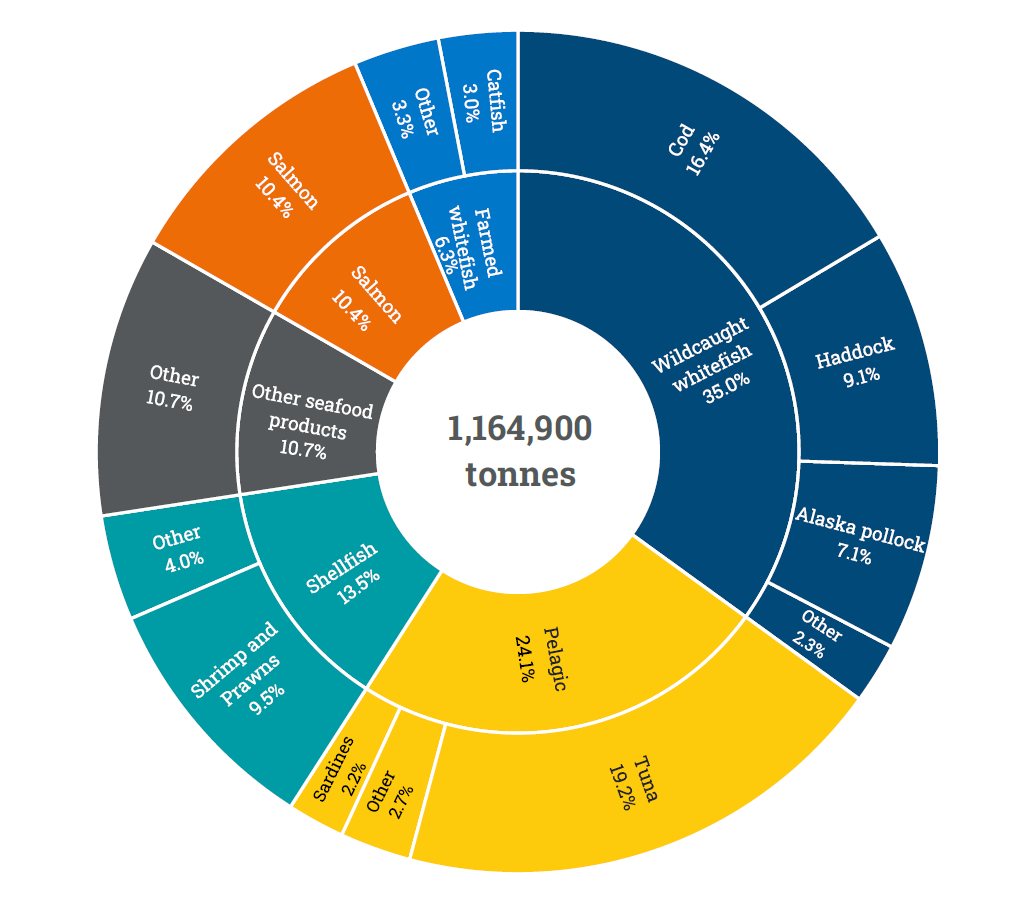
By the end of 2024, UK seafood imports were in full growth as annual declines reversed. Import supply, as indicated by the live weight of seafood imported, increased by 45,400 tonnes (+4.1%), totalling 1.16 million tonnes.
Import volumes for major seafood species increased, driven by recovering demand, global supply shifts, and trade dynamics. Although both import volume and value rose, fluctuations in prices and product types led to varied import values among species groups.
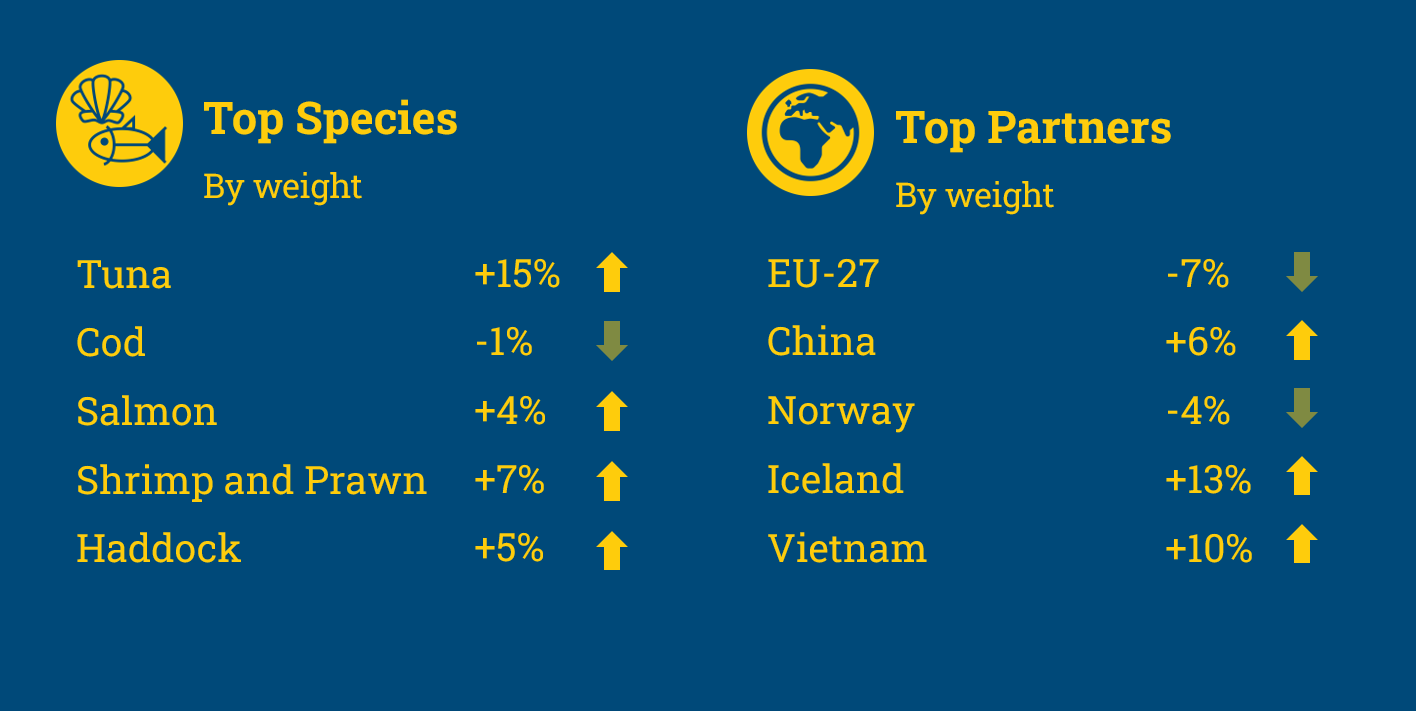
Imports from two major seafood suppliers declined. Norwegian imports fell 4.1%, driven by a drop in haddock, which outweighed increases in salmon and a slight decrease in cod. Imports from the EU fell by 7.0%, with declines across cod, surimi, Alaska pollock, tuna, and mackerel.
The UK’s demand for imported seafood mirrors growth in UK seafood consumption in and out of home by the end of 2024. Seafood sales returned to growth in retail and foodservice channels. Read more on UK seafood consumption.
Despite a rise in 2024, Seafood imports have seen declines over the past 5 years, down 14.4% since 2019 (CAGR of -2.9%). Shellfish and wild-caught whitefish have seen the greatest rates of decline.
Pelagic
Pelagic species saw the strongest import volume growth, rising by 10.3%, driven primarily by a 15% increase in tuna imports. Tuna accounted for nearly 80% of pelagic volume, with Ecuador emerging as a key supplier and China entering the UK tuna market for the first time with a 4% share.
Whitefish
Whitefish remained the largest imported species group (41.3% of total volume), with the smallest growth of 1.8%. However, whitefish import value fell 6.2%, reflecting a continued shift toward lower-cost species such as Alaska pollock and farmed whitefish. Cod import volumes declined slightly, but as Iceland increased its share of global Atlantic cod supply, its importance as one of the leading suppliers of cod to the UK increased.
Salmon
Salmon imports increased by 4.3%, driven by a 130% rise in Canadian supply, making Canada the UK’s 4th largest source. Despite this growth, total salmon import value fell by 1.5% due to a 5.4% drop in average price per kilo, particularly for chilled whole products.
Shellfish
Shellfish imports rose 8.3% in volume, with shrimp and prawns making up over 70% of the total shellfish supply. Growth came predominantly from warm water prawns, with strong increases from Vietnam, Ecuador, and Honduras outweighing the decline from India. China’s role expanded through increased squid and cephalopod exports. Value growth in shellfish of 2.4% was constrained by lower global prices.
Explore the full Seafood Trade Report
Dig deeper into UK seafood imports in the full report. The full trade report is is available to download at the bottom of this page.
Salmon and mackerel drive continued UK seafood export growth
Despite overall growth, it was a mixed story for seafood exports in 2024 as non-tariff barriers continued to present a challenge for UK seafood businesses exporting to the EU.
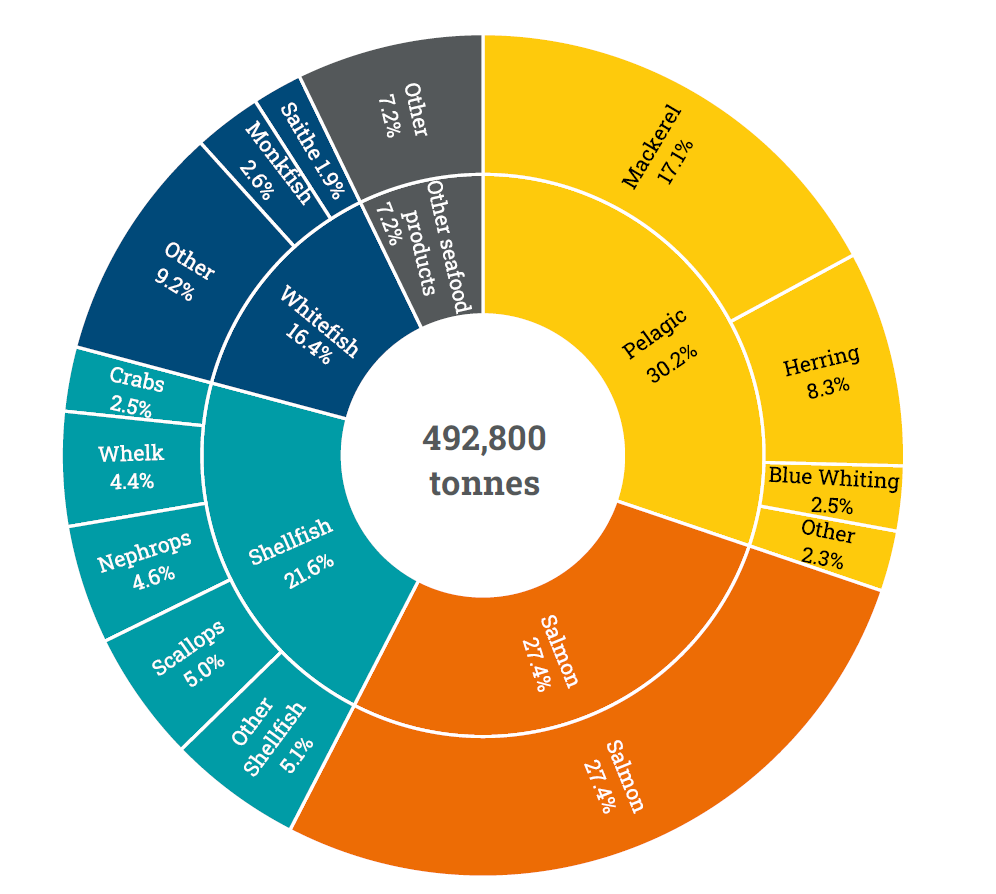
Markets in Asia and the USA drive overall growth in seafood exports in 2024. Export volumes rose by 11.4% (+50,400 tonnes) to a total of 492,800 tonnes, while export value grew by 13.0% (+£228.0 m), reaching £1.98 billion.
Total seafood export performance was heavily influenced by trends in salmon and mackerel exports. Exports of shellfish and whitefish species to key markets in the EU experienced an annual decline.
Salmon
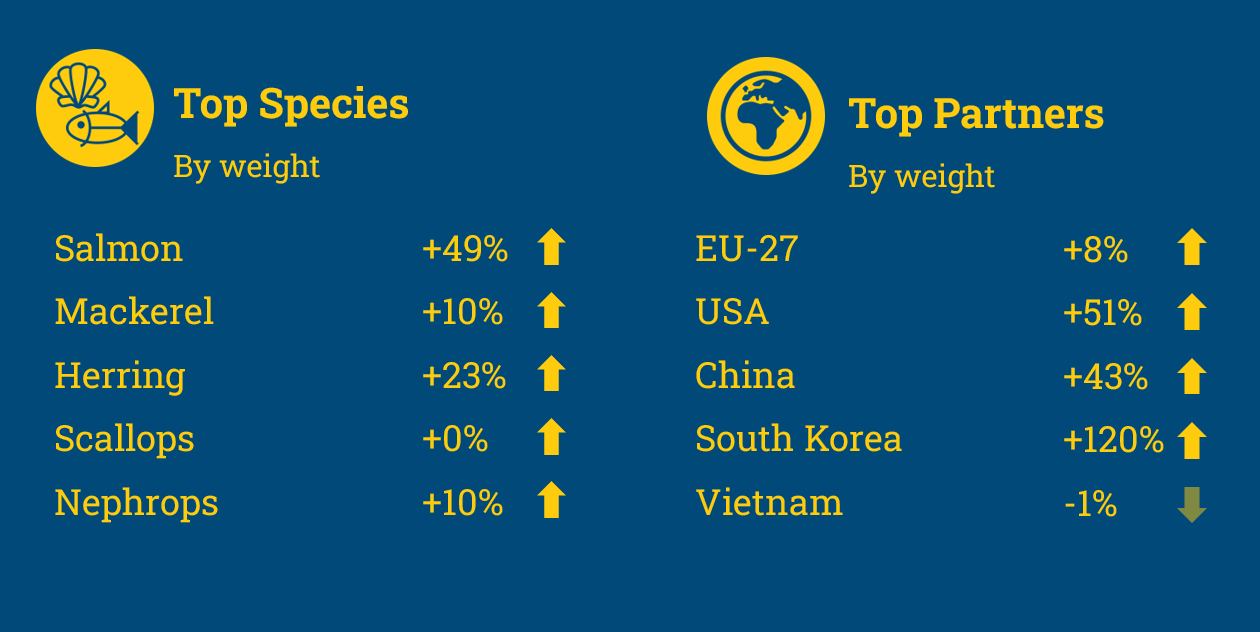
Salmon was the top performing species group, contributing the most to export growth. Growth of 42.0% was driven by higher exports to the EU, US, and China, supported by improved production and lower fish mortality rates.
Pelagic
Pelagic species also saw strong performance, indicated by both exports and landings abroad by the UK fleet. Export volumes grew 19.0% and value grew 26.5% compared to the year before as international demand increased for mackerel, herring, and blue whiting.
Shellfish
Shellfish exports varied greatly but overall declined in both volume (-5.1%) and value (-5.0%). Although the species group remained the second highest by value. Export value increased for Nephrops, whelk, and clam. Exports to Asia rose sharply, particularly to South Korea, India, and Vietnam, partially offsetting declines to the EU. Crab, cuttlefish, and lobster exports drove the overall decline in the export value of shellfish.
Whitefish (Demersal)
Whitefish exports declined both in volume (-7.3%) and value (-9.0%) to the lowest level in five years. Key species such as monkfish, sole, and hake experienced significant declines in both export value and landings. However, gains in cod, saithe, and ling exports provided some offset.
Further Information
Data caveat:
Published HMRC overseas trade in goods statistics are provisional for up to 18 months and so can be updated within this time. Therefore, the analysis presented in this document is provisional and subject to change.
Acknowledgements
Thank you to Trade Data Monitor LLC for providing monthly trade data and to the industry members and colleagues across Seafish for input and insights.
You can download a copy of the full report and acompanying data from the links below:
To access further information on our trade reports, please visit our Market Insight Portal or email joe.cooper@seafish.co.uk.