Latest Quarterly UK Seafood Trade Data
This webpage highlights the key trends in UK seafood trade for a calendar year on a quarterly basis. The content focuses on emerging changes to seafood trade flows in and out of the UK.
The latest content covers April to June 2023 compared to the previous year. You can download a copy of this report in a pdf format at the bottom of the page. Analysed trade data is provisional and subject to change.
This page has information on:
UK seafood trade has been volatile since 2020 when the coronavirus pandemic caused unprecedented trade issues globally. In 2021, complications from the UK leaving the European Union (EU) added to existing challenges. At the start of 2022, the Russian invasion of Ukraine lead to higher prices in global markets and changes to trade flows of goods.
At the same time, the UK was affected by a cost-of-living crisis as inflation soared above 10%. All these factors have, and continue to cause, significant disruption to the UK seafood supply chain.
- Import volumes continue to decline, likely linked to price rises. This most recent decline is the steepest in the last 10 years.
- Value of seafood imports grew, but at a slower rate compared to the previous quarter as all species groups continued to experience price inflation.
- Total seafood export value remained in price driven growth but remained below pre COVID-19 levels.
- UK seafood export volume continued in decline compared to a year ago, driven by a reduction in exported salmon and demersal species.
- The rate of price inflation for both imported and exported seafood continued to slow down over the period.
April to June 2023 Import Overview
In the 4 quarters to Q2 (Apr-Jun) 2023, total volume of imported seafood experienced one of the steepest declines of the past decade. This was driven by a decrease in the volume of salmon, shrimp and prawn, cod and haddock imported.
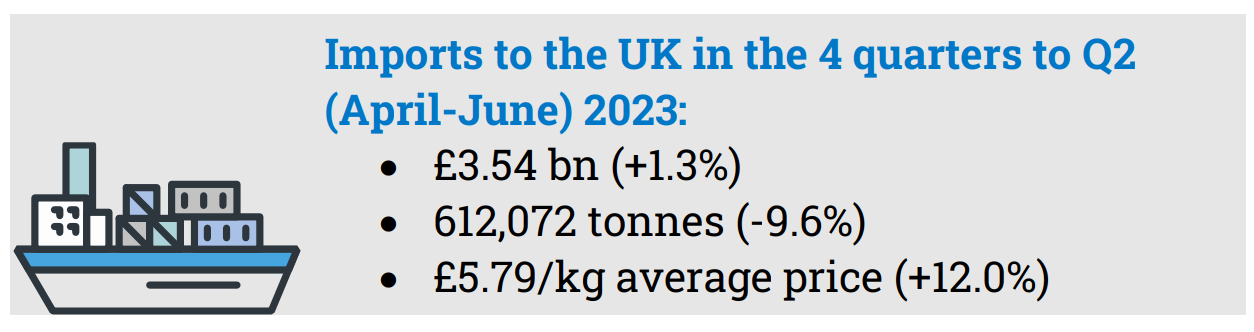
The value of imported seafood over the 12-month period was £3.54 billion, an increase of 1.3% on the previous period. Volume of imported seafood to the UK decreased -9.6% to 612,072 tonnes in the 4 quarters to Q2 2023.
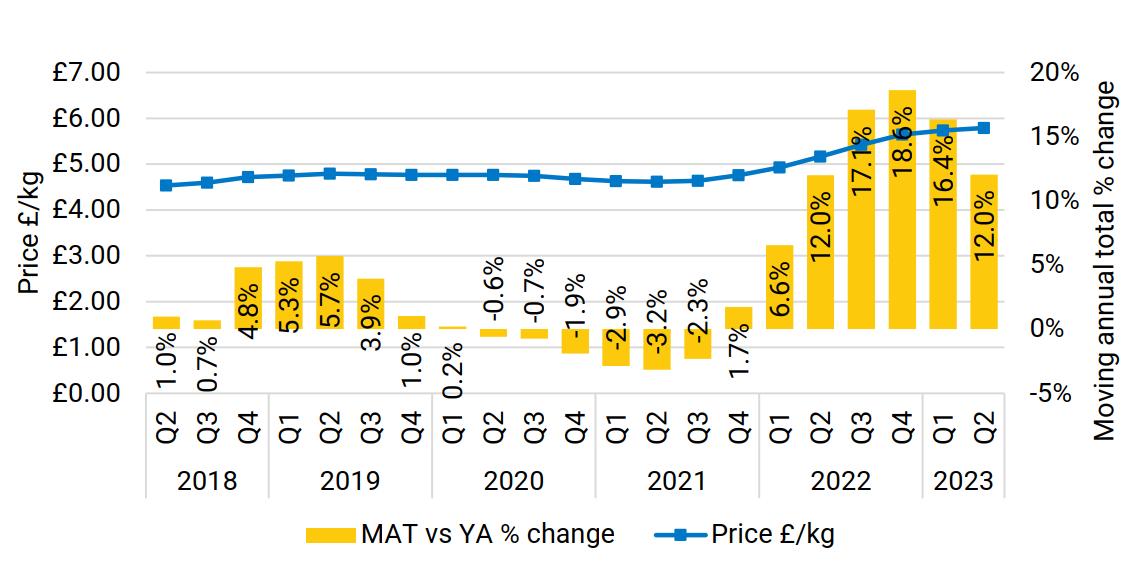
The price of imported seafood was still rising this quarter but not as fast as before. Price inflation of imported seafood eased this quarter to +12.0% down from +16.4% the previous quarter (figure 2). Imported seafood costs on average £0.62/kg more than it did a year ago.
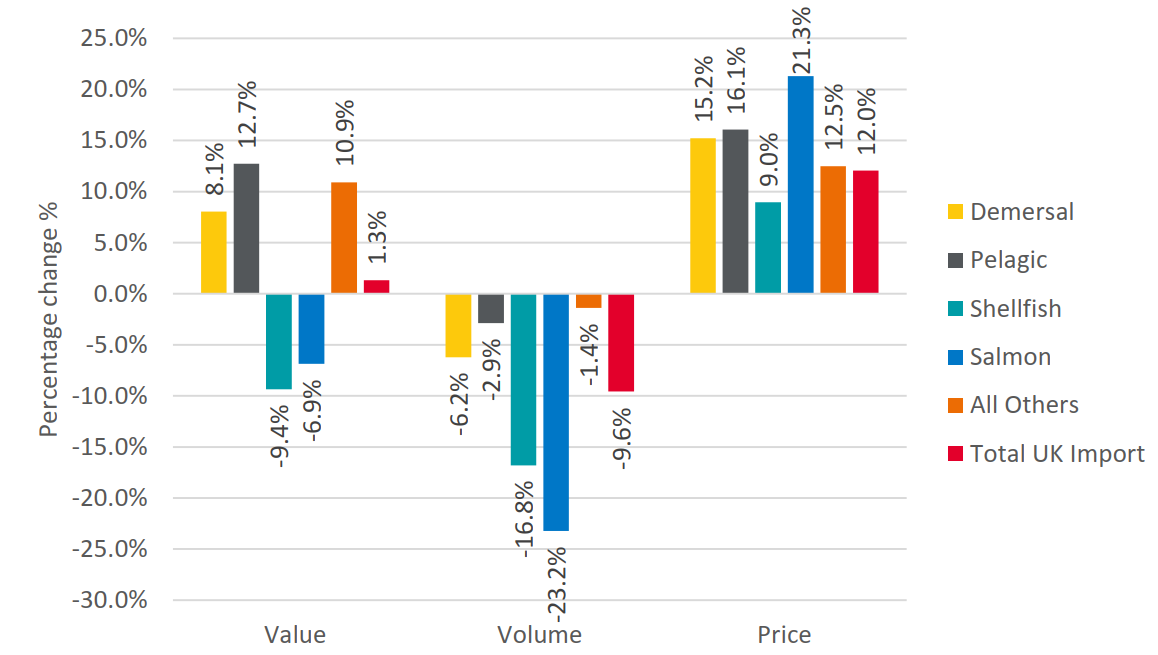
All groups of imported species continued to experience price inflation. Price inflation began easing for imported salmon, cod, shrimp and prawn in this quarter, yet prices remained at some of the highest of the past decade. Imported pelagic products started to experience growing price inflation. Global tuna supplies struggled in part due to fisheries in the Western Pacific, Indian and Atlantic Ocean experiencing a slow start to the year.
Key import data observations
Imported shrimp and prawn in decline
In UK retail, both cold-water and warm-water prawn were in volume decline as shoppers trade out of these higher value products during the cost-of-living crisis. The market share of warm-water and cold-water shrimp and prawn products in the UK’s seafood import market fell from 19.4% to 17.4% in the 4 quarters to Q2 2023 as £60.9m less (-9.0%) was imported. The volume imported dropped by 14,998 tonnes (-17.2%) over this 12-month period, down to 72,214 tonnes. Prices were 9.9% higher on average. Price inflation started easing this quarter at +9.9% down from +14.9% in the previous quarter.
The greatest decline in shrimp and prawn import was from Vietnam with 5,097 tonnes less imported (-24.2%) than a year ago. Vietnam’s warm-water shrimp export volume experienced an increase in the first 5 months of 2023 with higher volumes exported to key markets of China, Hong Kong, USA, the EU and Japan as average export prices to these markets eased. The proportion of Vietnam’s warm-water shrimp export destined for the UK declined, while export prices to the UK remained higher than a year ago. Generally, it is forecast that Vietnam’s warm-water shrimp export will slow as production drops later in 2023, with the shortfall in global supply likely to be picked up by Ecuador.
Ecuador increased warm-water shrimp production at the start of 2023 and is expecting to increase production throughout the year. Ecuador had an increase in export volumes to top markets of China, Europe and USA but a lower proportion to the UK. The average price of these exports fell more slowly for the UK market than other markets. However import prices have started to fall compared to prices last year and may continue to fall as Ecuador production increases.
The volume of shrimp and prawn products, which are likely all cold-water species, imported from Greenland (via Denmark), Canada, Iceland and Norway dropped -16.2% in the 4 quarters to Q2 2023.
Greenland is the largest supply area for cold-water shrimp to the UK. Lower consumer demand and price inflation during the cost-of-living crisis in the 4 quarters to Q2 2023 meant lower volumes of cold-water shrimp were imported than the year before. The year before, prices were particularly low and import volumes had risen. This led to the UK expanding its autonomous tariff quota (ATQ) of imported cold-water prawn from 6,500 tonnes to 9,700 tonnes for 2022, allowing higher volumes to be imported duty-free without the additional 20% tariff.
The decline in import volume in the 4 quarters to Q2 2023 may reverse later in the year as price inflation starts to ease and retail suppliers look to stock up for Christmas, however the ATQ duty-free quota was not carried over to 2023 which means that imports are more expensive than last year. Negotiations for a Greenland-UK free trade agreement (FTA) started in January 2022 but have not concluded and it is unclear if there is likely to be further tariff relief applied.
Price inflation hits imported pelagic products
Imported tuna products make up over three quarters of the value of pelagic products imported to the UK, although a growing proportion of these imports are mackerel and sardines. All three species experienced a rise in price inflation in Q2 2023. In contrast, price inflation was beginning to ease for other imported seafood products.
Lower volumes of tuna were imported from Ecuador and Ghana. This was partially offset by increased imports from the Philippines, Portugal and Mauritius. The volume of imported tuna dropped by 5,184 tonnes (-5.0%) to 99,202 tonnes. Tuna fisheries in the Western Pacific, Indian and Atlantic Oceans were slow at the start of 2023 with limited fishing activity. While tuna fishing activity in the Western Pacific started to pick up during Q2, new fisheries management interventions that ban fish aggregating devices are expected to be implemented in July 2023. This could continue to impact landings and have a knock-on impact on export volumes, keeping prices high. Price inflation of imported tuna products to the UK increased from +5.6% in Q1 to +15.4% in Q2.
April to June 2023 Exports Overview
In the 4 quarters to Q2 2023, total seafood export value continued to grow driven by price inflation but remained below pre COVID-19 levels. Exports of all species groups, apart from pelagic species, experienced inflated prices over this period (figure 3). Overall, a lower volume of seafood was exported from the UK compared to the year before.
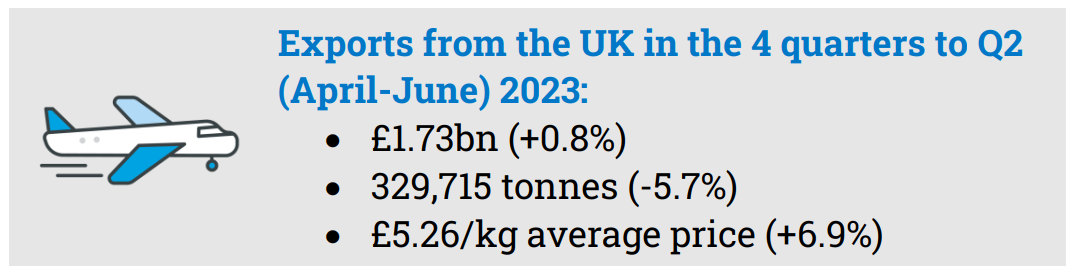
The value of seafood exports from the UK remains relatively steady, +0.8% higher than it was a year ago, at £1.73 billion. Total seafood export volume was 19,868 tonnes lower than it was a year ago, down -5.7% to 329,715 tonnes. Total seafood export volume has been in decline since the start of 2020, however the rate of decline continued to slow down in Q2.
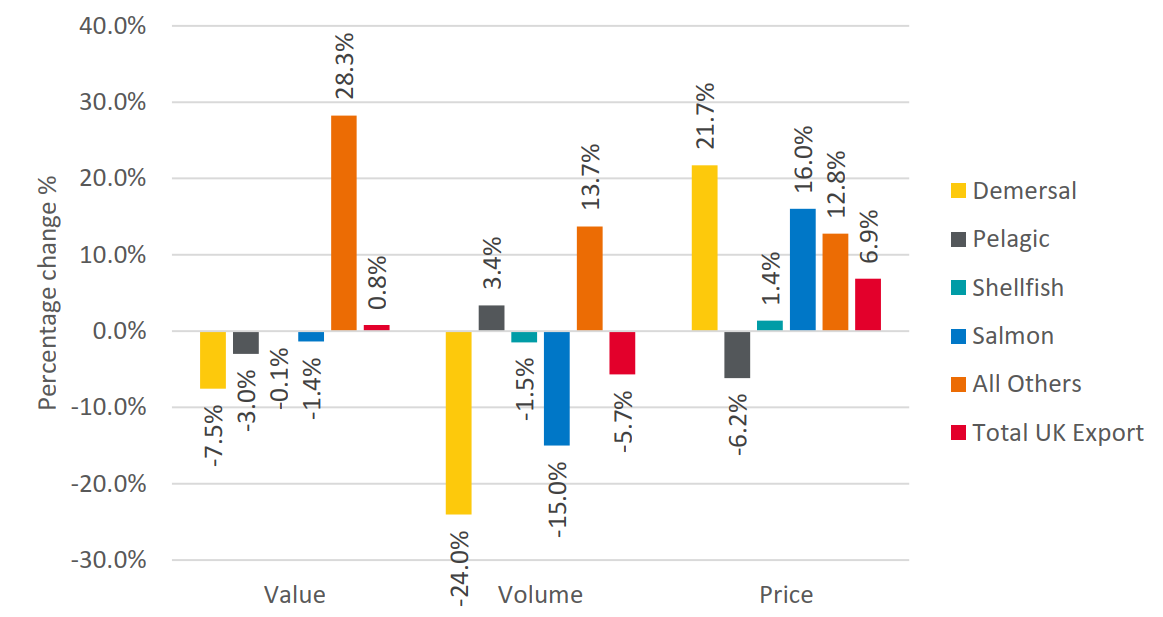
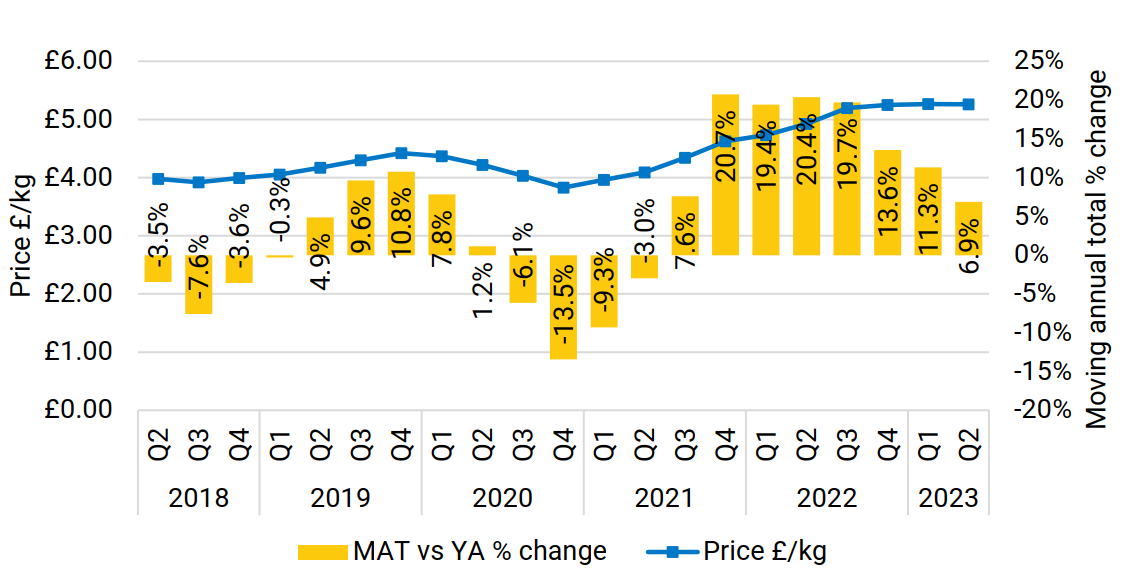
The average price for exported seafood continued to increase but at a slower rate - the average price increased by £0.34/kg since Q2 2022. Price inflation of exported seafood eased to +6.9%, down from +11.3% in the previous quarter (Figure 4).
Export value growth was most notable in trout, herring and some shellfish species, particularly shellfish dispatched to non-EU markets. Exported salmon and demersal species products continued to experience value decline as significantly lower volumes were exported than a year ago (figure 3).
Despite an increase in the export value of some shellfish species (cuttlefish, spiny lobster, mussels, whelks and nephrops) the overall shellfish export value declined very slightly over the period (by -0.1%). This slight decline was driven by a fall in the export value of clam, prawn, scallops and crab exports.
Key Export data observations
Recovery of herring exports
Herring export volume rose by 6,805 tonnes (+38.2%) to 24,639 tonnes in the 4 quarters to Q2 2023 although it remains below pre-2021 levels. As price inflation remains at +3.0%, the total value of exported herring increased by £8.7 million (+42.3%) totalling £29.3 million
Increased volumes of herring were exported to Nigeria, Germany, Lithuania, Canada, and Poland. Landings of herring to Norway and the Netherlands by the UK fishing fleet also increased. The volume of herring landings abroad by UK registered vessels increased by 4,935 live weight tonnes (+10.8%) over this 12-month period to 50,501 tonnes. The total value of herring landings abroad by UK vessels increased by £2.52 million (+9.4%) to £29.4 million.
The growth in herring exports is likely due to an increase in the catch allocation available to the UK fleet since 2021. Since leaving the EU, the UK has received a larger share of the total allowable catch (TAC) for jointly managed stocks between UK, the EU and Norway. In May 2023, the International Council for the Exploration of the Seas (ICES) recommended increasing the quota for North Sea Herring from 403,000 in 2023 to 532,000 tonnes for 2024 (+28.3%) reflecting recovering spawning stocks in 2022.
Shifting whelk export markets
The UK’s whelk export market has previously been primarily prepared/preserved whelk products destined for food service in South Korea. However, in this period, there was a shift to lower value frozen whelks for further processing and re-export, destined for retail markets in Asia.
The UK exported 8,909 tonnes of whelk products in the 4 quarters to Q2 2023, a rise of 2,211 tonnes (+33.0%). Whelk exports to Vietnam increased by 1,707 tonnes, to the EU by 1,533 tonnes and to Japan by 204 tonnes. These whelks are exported frozen to Asia and fresh to the EU.
The value of whelk exported over this period rose by £2.4 million (+6.1%) to £40.9 million, although the average price dropped by -20.2%. This is because a higher proportion of cheaper frozen and fresh whelk products were exported, as the proportion of higher priced prepared/preserved whelk products decreased.
As bars closed in South Korea during the covid-19 pandemic, demand dropped for canned whelk products that were being sold as a bar dish with noodles.
The volume of prepared and preserved whelk exported directly to South Korea declined sharply to 1,033 tonnes (-34.2%) over the 4 quarters to Q2 2023. This is likely due to the continued effects of Covid as demand has reduced alongside high stock levels.
Noteworthy national and international developments from April to June 2023 influencing UK seafood trade opportunities.
The UK free trade agreement (FTA) with Australia and New Zealand entered into force on 31st May 2023. This marked the UK’s first FTA signed as an independent trading nation since leaving the European Union. Import tariffs on many seafood items to the UK have been reduced to 0% or will be phased to 0%. Meanwhile tariffs on UK seafood exports to the two countries have been reduced to 0% for processed products meeting preferential origin rules. Australia and New Zealand already had most favoured nation rates, with seafood products exported from the UK already at 0% tariffs.
The UK concluded negotiations to join the Comprehensive and Progressive Agreement for Trans-Pacific Partnership (CPTPP), and the trade agreement began ratification, but had not yet entered into force. FTAs with Switzerland and India remain in negotiation. A call for input is announced as an FTA with Maldives begins consultation stage.
Three and a half years after the UK’s departure from the EU, trade with the EU continued to present some issues. During this period, the digitisation of Export Health Certificates (EHCs) remained on hold but remained a key priority for the UK Government following a successful pilot period. EHCs required to export to the EU have reportedly cost the salmon industry £2 million a year in additional administration costs and delays.
While UK exports to the EU must comply with full the extent of EU requirements, imports from the EU continue enter the UK with little administrative burden. The exception being non-EU fishery products that are imported into the UK via the EU. The Institute of Export and International Trade report that the delay in import controls is creating an unequal playing field and puts the UK at a significant competitive disadvantage.
You can download a copy of the full report from the link below:
To access further information on quarterly trade reports, please visit our Market Insight Portal or email joe.cooper@seafish.co.uk.